If your hiring dashboard does not tell you which roles are stuck, where money is leaking, and who needs to act this week, it is not doing its job.
I would boil this guide down to a simple point: build your recruitment dashboard around decisions, not reports. For scaling companies, that means setting the questions first, picking one source of truth for each KPI, keeping the metric set tight, and giving each stakeholder a view that matches what they need to decide. That is how you cut delays, protect budget, and keep hiring plans on track.
A weak recruitment setup costs more than most teams think. With median time-to-fill often sitting at 39 to 44 days, and vacancy costs often around $500 per day for standard roles, the price of poor visibility adds up fast. For revenue-linked hires, that can climb to $2,000 to $5,000+ per day. When you cannot see bottlenecks early, you pay for them later.
Here is the short version:
- Start with decisions, not charts or tools
- Define KPI owners so numbers stay consistent
- Use one system of record per metric
- Track a small KPI set such as time to fill, ageing roles, stage conversion, open reqs, offer acceptance, source performance, and retention
- Build separate views for recruiters, hiring managers, talent leaders, and executives
- Validate the data before rollout
- Use the dashboard in weekly hiring reviews
- Measure ROI through cost-per-hire, time saved, agency spend, and headcount delivery
If you are growing in SaaS, Tech, IT, Fintech, Engineering, Security, Insurance, or Professional Services, this is the difference between hiring with control and hiring by guesswork.
If internal bandwidth is thin, Rent a Recruiter can support delivery and adoption, and if you are weighing cost impact, you can review the numbers with this ROI calculator.
Below, I break down the setup in the order that matters most, so you can build a dashboard your team will use, and your leadership team will trust.
Build a Recruitment Dashboard in Power BI (Step-by-Step Guide)
Before building your dashboard, rate your recruitment process to identify the specific gaps you need to track.
sbb-itb-a23bd6a
Set the Dashboard Strategy Before You Build Anything
Once you know who the dashboard is for, the next step is simple: decide what it needs to drive.
Before you pick a tool, define the decisions the dashboard must support. Most teams start with tools or charts. That’s usually where things go off track.
Define Hiring Goals, Decisions, and Review Cadence
Start with the hiring outcomes your leadership team already cares about. Common examples include reducing time to fill, improving offer acceptance rate, tracking headcount plan delivery, and spotting stalled requisitions early.
Then turn each goal into a decision question.
If your goal is to reduce time to fill, the dashboard should show which stages are causing the longest delays and which roles are likely to miss forecast start dates. If your goal is to improve offer acceptance, it should show where offers are being declined by role, location, or compensation band.
This matters because dashboards are not there to look neat. They should help you act. If a metric does not lead to a clear decision, it probably does not belong on the page.
Once those questions are clear, set a review cadence based on how fast decisions need to happen.
- Recruiters and hiring managers usually need a daily or weekly view for day-to-day activity.
- Talent leaders often need a weekly or biweekly review to spot patterns across teams.
- Executives usually need a monthly or quarterly summary focused on headcount delivery, hiring cost, and forecast risk.
Different audiences move at different speeds. Your dashboard should match that, or it becomes noise.
Assign Stakeholders and KPI Ownership
Every metric on your dashboard needs a named owner. Without that, trust drops fast.
If one team measures time to hire from requisition approval, and another measures it from the job posting date, leadership will stop using the dashboard. The numbers may look close, but the decisions that come from them will not be.
Assign one owner for each metric’s:
- definition
- source
- calculation
- refresh schedule
Here’s how ownership often looks in a scaling team:
| Stakeholder | Primary KPI Owner |
|---|---|
| Talent Acquisition Leader | Operational definitions, process metrics, pipeline metrics |
| Recruiter | Funnel-stage accuracy, candidate activity |
| Hiring Manager | Feedback timeliness, interview scheduling, requisition prioritization |
| Finance / Workforce Planning | Alignment to the headcount plan, cost metrics |
| Executive Sponsor | Executive review of core KPIs |
Without clear ownership, metric definitions drift and adoption falls.
Document the goals, decisions, audiences, cadence, and KPI owners in a one-page strategy brief. That brief becomes the blueprint for choosing data sources and building the dashboard.
Choose Data Sources, Tools, and Core Recruitment KPIs
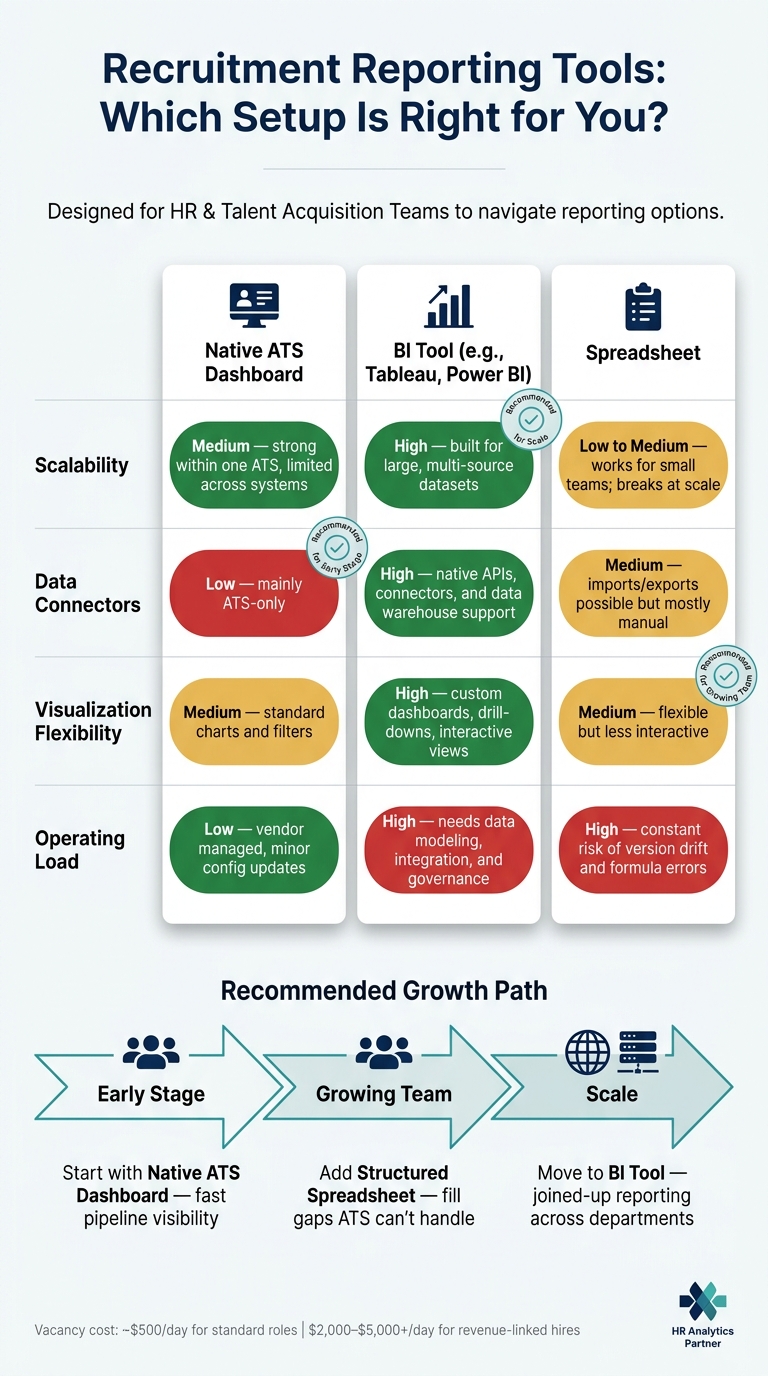
Recruitment Dashboard Tools Compared: ATS vs BI Tools vs Spreadsheets
Use the brief to lock in data sources, reporting tools, and the KPIs that help you make hiring calls with confidence.
Map Your Data Sources and Source of Truth
Recruitment data rarely lives in one place.
Your ATS usually holds candidate pipeline data, requisition status, stage timestamps, offer data, and application sources. Your HRIS owns headcount records, start dates, org structure, and retention outcomes. Sourcing tools track outreach volume and lead activity. Spreadsheets often patch gaps where systems fall short. Then there are informal updates, which tend to hold last-mile details like verbal offers or expected start dates.
This is where reporting goes sideways.
If time to fill is pulled from the ATS requisition open date in one report, but from a spreadsheet "open" date in another, your leadership meeting stops being about action and turns into an argument about which number is right.
The fix is simple: assign one system of record per metric.
- Time to fill comes from the ATS
- 6-month retention comes from the HRIS
- Source effectiveness comes from the ATS application source field, not manual spreadsheet labels
Write this down in a simple mapping:
metric → system of record → owner → update cadence
That one step cuts confusion, saves time, and gives leadership a number they can trust.
Once each metric has a single source of truth, you can choose a reporting layer that shows it the same way every time.
Compare Native ATS Dashboards, BI Tools, and Spreadsheet Setups
With sources defined, pick the lightest reporting setup that can support them without creating extra admin. The right choice depends on hiring volume, who needs the data, and how much system integration you can handle.
| Dimension | Native ATS Dashboard | BI Tool | Spreadsheet |
|---|---|---|---|
| Scalability | Medium, strong within one ATS, limited across systems | High, built for large, multi-source datasets | Low to Medium, works for small teams; breaks at scale |
| Data connectors | Low, mainly ATS-only | High, native APIs, connectors, and data warehouse support | Medium, imports and exports possible but mostly manual |
| Visualization flexibility | Medium, standard charts and filters | High, custom dashboards, drill-downs, and interactive views | Medium, flexible but less interactive |
| Operating load | Low, vendor managed, minor configuration updates | High, needs data modeling, integration, and governance | High, constant risk of version drift and formula errors |
For a scaling SME, the usual path is pretty practical. Start with native ATS dashboards to get pipeline visibility fast. Add a structured spreadsheet for extra views your ATS cannot handle cleanly. Move to a BI tool when hiring becomes a business-wide priority across several departments and you need joined-up reporting for leadership.
That keeps costs under control early on, while giving you room to grow when reporting needs get more serious.
Define the KPIs That Actually Support Hiring Decisions
Once the tooling is set, keep the dashboard tight.
The goal is not to track everything. The goal is to track the metrics that push action. Start with a small KPI set and focus on two questions:
- Are we on track?
- Where do we need to act?
| KPI | Definition | Formula | Source | Decision It Supports | View |
|---|---|---|---|---|---|
| Time to Fill | Days from requisition open to accepted offer | Offer Accepted Date – Req Open Date | ATS | Monitor hiring speed; flag slow roles | Recruiter, Talent Leader, Executive |
| Time to Hire | Days from candidate entry to accepted offer | Offer Accepted Date – Candidate Entry Date | ATS | Compare process efficiency across teams or role types | Recruiter, Talent Leader |
| Open Requisitions | Count of reqs with "open" status on a given date | Count of open reqs | ATS | Monitor workload; align capacity to hiring plan | Recruiter, Talent Leader, Executive |
| Candidates by Stage | Count of candidates in each pipeline stage | Count per stage | ATS | Check pipeline health; prioritise sourcing or screening | Recruiter, Talent Leader |
| Stage Conversion Rate | % of candidates advancing from one stage to the next | (Candidates in next stage ÷ Candidates in current stage) × 100% | ATS | Identify weak funnel stages; improve criteria or calibration | Recruiter, Talent Leader |
| Aging Roles | Open reqs older than a defined threshold (e.g., 45 or 60 days) | Count of open reqs past threshold | ATS | Flag at-risk roles; escalate support or re-scope | Recruiter, Talent Leader |
| Offer Acceptance Rate | % of offers accepted out of total offers extended | (Offers Accepted ÷ Offers Extended) × 100% | ATS / HRIS | Diagnose compensation issues or candidate experience gaps | Talent Leader, Executive |
| Source Effectiveness | Hires generated by each source | Hires from source ÷ candidates from source × 100% | ATS with structured source field | Optimise budget and recruiter time toward top-performing sources | Talent Leader |
| Retention Rate (6 or 12 months) | % of hires still employed at 6 or 12 months | Employees still employed N months after hire ÷ employees hired N months ago × 100% | HRIS | Connect hiring quality to long-term business outcomes | Talent Leader, Executive |
Each KPI should have a target range and a clear decision rule.
For example, strong teams often keep offer acceptance rates between 85% and 90%. If you drop below that, review compensation, expectations, and candidate experience before sending more offers. Time to fill benchmarks vary by role, but individual contributor roles often sit in the 21 to 45 day range, and the trend matters more than any single data point.[1][2]
Design and Build a Dashboard People Will Actually Use
Now turn those KPIs into role-based views, clean data, and a weekly rhythm your team can stick to. Once your KPIs are set and your data sources are mapped, the next step is simple: build something people will use in real hiring decisions every week.
Build Simple Views for Recruiters, Talent Leaders, and Executives
Create separate views for recruiters, talent leaders, and executives. Put KPI cards in the top-left, charts in the middle, and action tables at the bottom.
That layout works because it mirrors how hiring teams think. First, they want the headline. Then they want the pattern. Then they need to know what to do next.
| Visual Type | Best For | Recruitment Use Case |
|---|---|---|
| KPI Cards | Fast status checks, targets vs. actuals | Are we on track for 15 hires this month? |
| Funnel Chart | Identifying stage bottlenecks and drop-offs | Where are candidates falling out between screening and interview? |
| Trend Chart | Monitoring changes over time | Is time-to-fill improving quarter over quarter? |
| Bar Chart | Comparing categories | Which sources deliver the most qualified candidates? |
| Table | Actionable, record-level follow-up | Which candidates or jobs need attention right now? |
Keep each view tight.
- Recruiters need the action table front and center.
- Talent leaders need funnel and trend charts to spot patterns across roles and teams.
- Executives need KPI cards, trend charts, and a high-level view of roles at risk.
If every user sees the same dashboard, one of two things usually happens. It becomes too detailed for leadership, or too vague for the people doing the work. Neither helps hiring outcomes.
Clean Data, Backfill History, and Validate Every Metric
Once the layout is set, check the data behind each metric.
Start by standardising stage and source labels. Then fix date issues before anything goes live. If one recruiter logs a source as “LinkedIn” and another uses “LI”, your source data is already off. The same goes for stage names that mean the same thing but appear as different labels in the ATS.
After that, backfill enough history to show reliable trends. Apply your current stage and source definitions to older records so trend charts compare like with like. If older data is incomplete, label those metrics clearly as reliable from a specific date onward. Don’t leave unexplained gaps. People will spot them, and once trust slips, usage drops with it.
Then validate everything. Pull sample raw ATS records and manually calculate:
- time-to-fill
- stage conversion rates
- funnel counts
If the dashboard numbers don’t match your manual checks exactly, stop and investigate before rollout.
Also test your filters, department, location, and date range. Make sure combining filters doesn’t drop records or count them twice. Then log in under each user role and confirm permissions are working as expected. Sensitive data, such as compensation details, should only be visible to the right people.
This part can feel tedious, but it saves time later. A dashboard that looks polished but shows the wrong numbers will do more harm than good.
Embed the Dashboard Into Weekly Hiring Operations
Once the numbers are clean, make the dashboard part of weekly hiring reviews.
Use it as the agenda. Open with KPI cards to set context, hires versus plan, open roles, and key conversion rates. Then move to funnel charts to spot current bottlenecks by team or role type. After that, work through the action table. Which aging roles need a sourcing change? Which candidates have been sitting still for more than five business days? Who owns the next step?
That’s where the business value shows up. You save time in meetings, cut back-and-forth, and make ownership clear.
Start with a pilot in one department before a company-wide rollout. Ask that group to use the dashboard for all pipeline reviews and daily prioritisation. Then collect feedback on what feels unclear, what’s missing, and what they’re still tracking in a duplicate spreadsheet.
That last point matters. If people are still keeping a side spreadsheet, your dashboard isn’t answering their real questions yet. Fix that before you expand access.
If internal bandwidth is tight, Rent a Recruiter can embed recruiters who keep the dashboard current and drive adoption. For more insights on optimizing your hiring process, explore The Talent Fix recruitment blog.
Maintain Dashboard Accuracy, Measure ROI, and Plan Your Next Step
Once your dashboard is live, the job changes. You’re no longer just building reports. You’re protecting data trust as your hiring process shifts.
A recruitment dashboard only helps if people believe the numbers. If stages change, sources get logged badly, or teams start using different labels for the same thing, trust drops fast. And when trust goes, so does usage.
Create Governance for Data Quality and Reporting Trust
After launch, keep an eye on stage, source, and taxonomy drift. Give one person ownership of the dashboard itself, and assign an owner for each data feed too.
Run a monthly health check. Look for odd spikes, missing fields, and changes in how teams are using the ATS. Review metric definitions against current workflows so your reporting still matches what happens on the ground.
Any time the ATS workflow changes, or a new hiring team comes in, audit your stage mapping and source tracking. The question is simple: does the dashboard still reflect how hiring works today?
If "other" or unclassified sources start climbing, that’s usually a warning sign. People may need retraining, and your ATS drop-down options may need tightening. Small fixes here can save hours of reporting clean-up later.
Connect Dashboard Performance to Cost, Time, and Growth Outcomes
Once the dashboard is used weekly, test whether it’s changing hiring speed and spend, not just giving you nicer reports.
Start with a baseline before any dashboard updates go live:
- Cost-per-hire
- Agency spend
- Average time-to-fill
Then track the same numbers every month. That gives you a clean before-and-after view, which matters if you’re speaking to a CEO, CFO, or board.
In one reported case study, improved analytics contributed to a 42% reduction in cost-per-hire, dropping from $4,700 to $2,700, alongside a 22% reduction in time-to-hire, from 36 to 28 days. [3]
Another strong ROI signal is lower external hiring spend. If your dashboard shows that internal channels like referrals, direct sourcing, and inbound are producing better hires on a repeat basis, you can shift budget away from high agency fees.
Rent a Recruiter clients using an embedded, fixed-fee model typically reduce hiring costs by up to 70% compared with traditional agency fees, while saving over 80 hours per month in internal hiring and admin time.
Track those hours as a KPI. They matter.
Time won back by recruiters and hiring managers isn’t just a nice extra. It’s budget capacity. It’s time that goes back into product, customer work, or leadership focus.
Conclusion: Build a Recruitment Dashboard That Supports Better Hiring Decisions
If the dashboard is delivering, record the gains and set the next review cycle.
The sequence in this guide is straightforward: define the decisions first, map your data sources, keep KPIs tight, build role-based views, and keep governance in place as hiring grows. Miss one of those steps, and the dashboard turns into a reporting artifact instead of a tool that helps you act.
Benchmark your current cost-per-hire, agency spend, and time-to-fill, then book a call to compare them with an embedded hiring model.
FAQs
What should I track first?
Start with a single source of truth, usually your applicant tracking system, so you can track every open role and every candidate stage in one place.
That matters more than most teams think. If hiring data sits across spreadsheets, inboxes, and Slack threads, you lose time, miss bottlenecks, and make decisions off partial information.
Focus first on the core metrics:
- Time-to-fill
- Cost-per-hire
- Offer acceptance rate
- Pipeline velocity
These show hiring speed, spend, and conversion. In plain terms, they tell you how fast you hire, what it costs, and where candidates drop out.
Once that baseline is in place, add quality-of-hire metrics such as 90-day retention. Speed and cost matter, but if new hires leave early, the business pays for the same role twice.
When should I upgrade my dashboard setup?
Upgrade your dashboard setup when spreadsheets and other manual workarounds stop keeping up.
Once you’re hiring across multiple roles, manual tracking often leads to patchy data, missed updates, and slow reporting. That makes it harder to see what’s working, where candidates are getting stuck, and where your team is losing time. As you scale, moving to an ATS gives you cleaner data and much better pipeline visibility.
You should also make the switch if you can’t track core hiring metrics, like time-in-stage, scorecard completion, or recruiter workload, without exporting data by hand. That’s usually the point where the process is costing more than it seems, in time, reporting effort, and hiring control.
If your team is already stretched, Rent a Recruiter can help put the right structure in place to support growth.
How do I know the data is accurate?
Data accuracy starts with one source of truth. If recruitment and finance are working from different numbers, your reporting breaks down fast.
Set standard metric definitions in a shared data dictionary so both teams use the same criteria. That matters more than most teams think. If one team counts a hire from offer acceptance and another counts it from start date, your cost and time metrics won’t line up.
You should also set a Required Fields Policy in your ATS for key data points like source attribution, stage dates, and IDs. This cuts down on manual gaps and makes reporting far more reliable.
Then back it up with a weekly data audit. Use that check to:
- merge duplicates
- fill missing dates
- flag stalled candidates
It’s simple work, but it protects the numbers you use to make hiring and budget decisions.