I recommend testing predictive analytics against structured recruiter-led hiring before you commit to a rollout. Compare matched tech roles for at least two quarters, measuring hiring speed, quality, retention, and total cost. A useful pilot target is 15% faster hiring without lower quality, not a promised result.
My approach is simple: use forecasts to support repeat hiring, keep recruiters accountable for context and decisions, and count setup, validation, and monitoring costs. Saved hours are extra capacity, not cash savings, unless spending falls.
Quick Comparison
| Decision factor | Predictive analytics | Structured recruiter-led hiring |
|---|---|---|
| Speed and capacity | Helps prioritise high-volume work | Depends on recruiter workload and coordination |
| Quality and retention | Needs reliable data and outcome testing | Adds context through consistent assessment |
| Total cost | Includes software, setup, and monitoring | Includes recruiter and hiring-team time |
| Accountability | Requires validation and human review | Requires scorecards and review of decisions |
| Best fit | Recurring roles with usable hiring data | New, specialist, or changing roles |
Below, I explain how to test both approaches and make expansion depend on measured hiring results, not speed claims.
Data-Driven Recruitment: How to predict the success of your hires
sbb-itb-a23bd6a
1. Hiring With Predictive Analytics
Predictive analytics can help when manual screening can’t keep pace with hiring demand. Measure its impact on hiring speed, quality, and total cost, not just screening volume.
Hiring Speed and Capacity
Use forecasts to rank sourcing channels, prioritize candidates against defined technical requirements, and flag interview bottlenecks. Track time saved across the full hiring process, along with model overrides and the reasons for them.[3][5] Faster screening only pays off if it improves hire quality.
Candidate Quality and Retention
Define success before training the model. Measures can include technical assessment results, successful completion of probation, manager-rated performance using a standard rubric, or productivity milestones.
Track retention at 6 and 12 months. Separate selection failures from turnover caused by pay, management, workload, or organizational change. Review rejected candidates for false negatives, and compare model-selected candidates against a consistent baseline through a pilot or phased rollout.[6] If quality improves, check whether those gains justify the full cost.
Total Hiring Cost
Count licenses, integration, validation, audits, training, accessibility accommodations, candidate communications, security, and continued human review, not just screening time.
Compare total recruiting spend and internal workload against your baseline. A lower cost per hire can mask higher costs from candidate withdrawals, rework, turnover, or legal exposure.
Bias and Accountability
Require job-related, explainable factors behind every recommendation. Test for proxy bias linked to school prestige, home addresses, and employment gaps.
Check performance separately by technical specialty, seniority, and candidate group. An overall accuracy score can hide unequal error rates. Give recruiters authority to override recommendations, require documented reasons, and suspend the tool if accuracy or fairness falls below approved thresholds.[4]
2. Hiring With Recruiter Judgment
Recruiter judgment adds context that predictive analytics and rules can miss: career changes, motivation, and constraints. It offers more context, but less scale.
Hiring Speed and Capacity
Strong networks and direct access to hiring managers help recruiters re-engage qualified candidates and resolve concerns fast. But manual coordination limits how many roles they can handle.
Track time to slate, time to interview, time to offer, recruiter workload, and requisitions per recruiter. Use actual workload and funnel conversion rates to forecast delivery, rather than relying on confidence alone.
Candidate Quality and Retention
Recruiters should clarify compensation, on-call duties, remote-work expectations, and advancement before an offer. This helps you check whether expectations align before making a hire.
Keep relationship-building separate from scoring. The U.S. Office of Personnel Management identifies structured interviews as more reliable, valid, and legally defensible than loosely defined interviews.[7] Ask consistent, job-related questions, with room for contextual follow-ups.
Total Hiring Cost
No outside fee does not mean no hiring cost. Count recruiter compensation, sourcing, scheduling, and interview time to see what tech recruitment solutions cost your business.
Bias and Accountability
Human assessment is inconsistent. A 2021 study found poor agreement among recruiters assessing candidate motivation, with Krippendorff’s α of 0.29.[8]
Require interviewers to submit independent scorecards before group discussion. Replace “culture fit” with documented, job-related evidence, and calibrate interviewers when ratings diverge. Use those scorecards to compare recruiter judgment against predictive tools on speed, cost, and retention.
Measuring Hiring Results and Costs
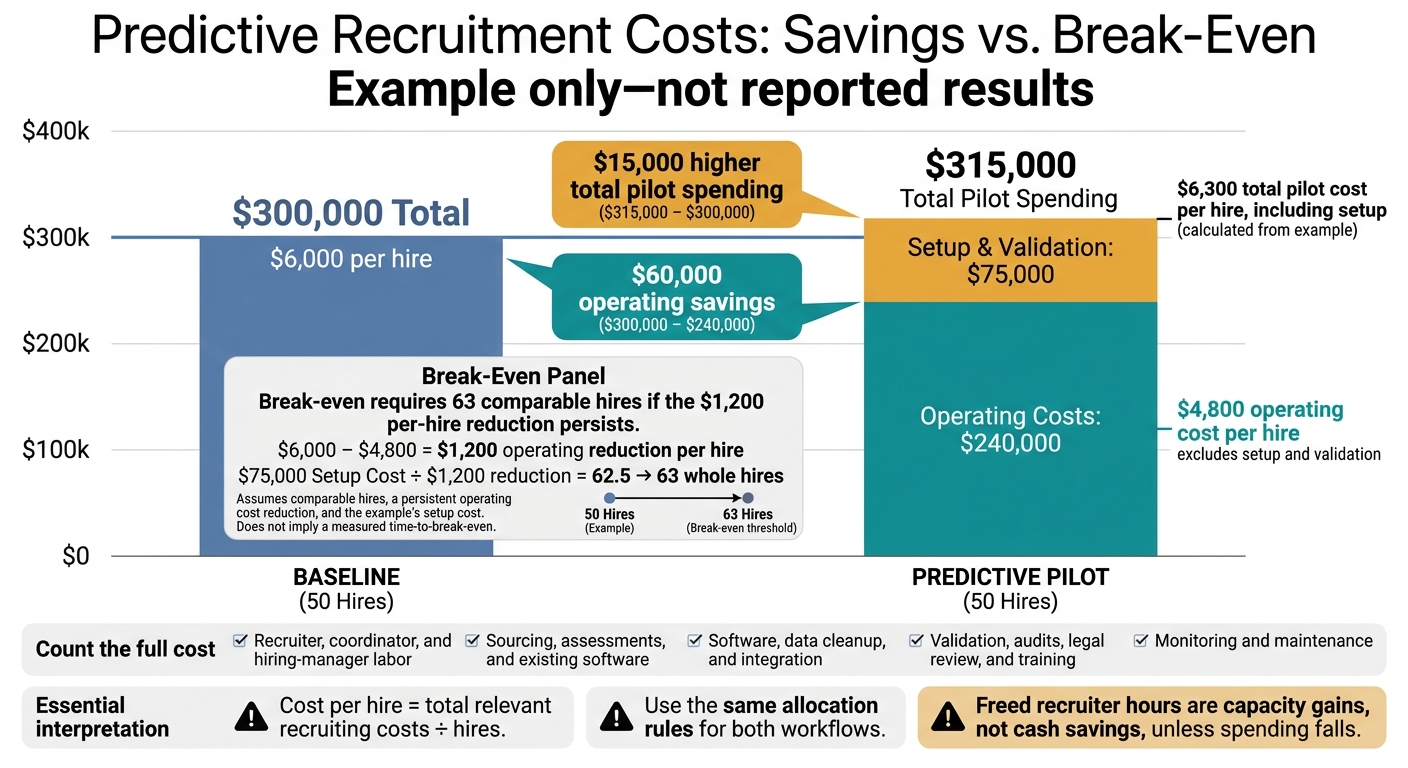
Predictive Recruitment Costs: Savings vs. Break-Even
Compare predictive analytics with recruiter-led hiring across matched role families, seniority levels, and locations for at least two quarters. Use 3-6 months of baseline data and, where possible, a concurrent control group. Account for changes in staffing, compensation, and the labor market.
The test is whether the tool delivers better results with the same inputs, not whether it feels faster. Compare speed, candidate outcomes, retention, and total cost. Published results reflect their own context; they do not automatically apply to your business.
Measuring Hiring Speed and Capacity
Measure time-to-fill from requisition approval to accepted offer and time-to-hire from application to accepted offer. Use calendar days.[9] Combine ATS timestamps with time logs and workload records.
Agree on decision rules before launch. These are targets, not benchmarks. Predictive analytics should increase hiring throughput without reducing hire quality.
| Metric | Comparison rule | Measurement period | Preset decision threshold |
|---|---|---|---|
| Time-to-fill and time-to-hire | Compare matched roles separately | Baseline and pilot quarters | At least 15% faster, without worse quality |
| Qualified applicants ÷ all applicants | Keep qualification criteria fixed | Application cohort | At least 10% relative improvement |
| Interviews ÷ qualified applicants | Compare matched requisitions | Requisition cohort | Improvement without unexplained subgroup disparities |
| Hours per hire; active requisitions per recruiter | Compare time logs and workload | Monthly, segmented by volume | At least 20% fewer hours; workload within recruiter capacity |
| Process consistency | Compare variation in stage timing and scoring | Entire pilot | No material increase in variation |
Measuring Candidate Quality and Retention
Faster hiring only pays off if quality and retention hold up. Prediction accuracy is not the same as hiring success. Use job-related assessments and post-hire outcomes to judge results.[10] Predictive tools need to improve accepted-offer quality, performance, and retention compared with recruiter judgment.
Measure calibration, prediction errors, and subgroup outcomes. Data covering only hired candidates cannot measure false negatives, so use a validation method that can. Check for drift when roles, applicant pools, or market conditions change.
| Outcome and definition | Observation window | Comparison rule and decision threshold |
|---|---|---|
| Offer acceptance: accepted ÷ issued offers | Offer cohort | Comparable compensation; no material decline |
| Job-related assessment score | Assessment stage | Document job relevance and use identical scoring |
| Performance: predefined rating or milestone | 6-12 months | Calibrate manager ratings; require at least equal results |
| Early attrition: departures within 90 days | 90 days after start | No increase; review subgroup outcomes |
| Retention: hires still employed | 6 and 12 months | Equal follow-up; require improvement that holds over time |
| Prediction errors and calibration | Each mature cohort | Compare predicted and observed outcomes; investigate underperforming high scorers |
Calculating Hiring Costs and Break-Even
Once you have measured speed and quality, compare the full cost of each workflow. Calculate cost per hire = total relevant recruiting costs ÷ hires, using the same allocation rules for both.[9] Repeatable roles and enough hiring volume make setup costs easier to recover.
Freed recruiter hours are capacity gains, not cash savings, unless spending falls. Those hours have a business impact when they reduce spending or let you hire more at the same cost.
If you use Rent a Recruiter, include the service fee and any remaining internal work. Treat saved hours as capacity unless payroll or contractor spending falls.
| Cost component | Measurement period | Break-even condition |
|---|---|---|
| Recruiter, coordinator, and hiring-manager labor | Monthly or quarterly | Verify hours and loaded labor rates |
| Sourcing, assessments, and existing software | Matched quarter | Allocate consistently across comparable hires |
| Software, data cleanup, and integration | Setup and contract year | Include upfront and recurring charges |
| Validation, audits, legal review, and training | Setup and annual | Separate one-time from recurring costs |
| Monitoring and maintenance | Quarterly | Include staff time and support |
Example only – not reported results: For 50 hires, baseline costs of $300,000 ($6,000 per hire) versus predictive operating costs of $240,000 ($4,800 per hire) yield $60,000 in operating savings, but $75,000 in setup and validation raises total pilot spending to $315,000. Break-even requires 63 comparable hires if the $1,200 per-hire reduction persists.
Managing Bias, Compliance, and Setup
Performance is only part of the decision. Before rollout, you need to know whether your hiring process can run lawfully, securely, and consistently. Faster hiring or better quality scores are not enough. The workflow must also stand up to scrutiny and produce repeatable results.
Both people and automated tools can repeat bias, even when they apply criteria consistently. Document each model’s purpose, role coverage, inputs, target outcome, limits, and who has authority over hiring decisions. Base criteria on actual job requirements, not similarity to past hires.
| Risk source | Likely effect | Controls | Monitoring | Accountable owner |
|---|---|---|---|---|
| Human inconsistency | Uneven scoring | Structured interviews, anchored scorecards, interviewer training, documented criteria | Ratings and pass-through rates by demographic group | Hiring manager and recruiting lead |
| Historical exclusion | Past bias repeated | Review labels and validate job-related outcomes | Adverse-impact testing and post-hire reviews | People analytics, HR compliance, model owner |
| Proxy discrimination | Non-job-related proxies | Limit inputs to job-related information; review proxy risks | Feature drift, subgroup errors, selection rates | Data science and legal/compliance |
| Automation overreliance | Scores used as auto-rejects | Human review, explanations, override procedures, escalation paths | Audit logs of scores, rationale, reviewer actions, overrides, and outcomes | Recruiting operations and hiring managers |
Check federal, state, and local rules before deployment. Buying vendor software does not remove your liability as an employer.[14][15] Apply current notice, audit, consent, and deletion requirements for the locations where you hire.[11][13][12]
Build safeguards into each hiring step. Collect only relevant data, set retention and deletion rules, encrypt records, and restrict access. Document notices and accommodations. Log model versions, inputs, recommendations, overrides, and final outcomes. Where feasible, keep demographic audit data separate from selection inputs.
Explain the tool’s purpose, major inputs, limitations, and human contact point. Test forms and assessments with assistive technology, and provide accommodation channels and suitable alternatives.
Setup is part of your hiring model, including its cost and delivery timeline. Move from testing to live use in stages:
- Define intake and purpose, complete job analysis and scorecards, and clean up ATS/HRIS data.
- Complete legal, security, and accessibility reviews, then validate before deployment. Run a limited shadow pilot, train human reviewers, track post-hire outcomes, and recalibrate or retire the model as needed.
Small employers with limited subgroup data should treat predictions as provisional and rely on structured review.
Assign a named owner and a maintenance budget before launch. Review adverse impact monthly or quarterly based on hiring volume and risk, and after material changes or complaints. The four-fifths rule is a screening signal, not a legal defense. Pause use if you find unexplained disparities, invalid data, or security failures.
Conclusion: Choose the Right Hiring Approach
Choose based on hiring conditions, not speed claims. Analytics can reduce repetitive work, but setup, validation, and monitoring add costs. Recruiter-led hiring is better suited to assessing less conventional career paths and building relationships with hard-to-fill technical talent. Compare both on hiring outcomes and total cost.
Apply the same criteria used throughout this article: hiring volume, data quality, role repeatability, compliance readiness, and total cost. Use the table below to assess where predictive analytics fits your recurring engineering, product, or infrastructure hiring.
| Decision factor | Structured recruiter-led hiring | Selective predictive pilot | Full analytics rollout |
|---|---|---|---|
| Hiring volume | Low or irregular | Moderate, with recurring roles | High and sustained across teams |
| Data maturity | Limited, inconsistent, or not linked to outcomes | Usable historical data with defined outcomes | Standardized, representative datasets validated over time |
| Role repeatability | New, specialized, or changing roles | Similar roles with stable competencies | Standardized role families |
| Compliance readiness | Limited governance or audit capacity | Named owners, documented controls, and pilot reviews | Formal audits, monitoring, accommodations, and vendor oversight |
| Setup capacity | Little time for integration or training | Dedicated pilot owner and evaluation period | Continued technical, legal, HR, and analytics support |
| Consequences of error | High individual, legal, or business impact | Can be contained through human review and limited scope | Acceptable only with strong safeguards and escalation paths |
For a pilot, measure results against a structured hiring baseline. Track time to fill, 90-day retention, offer acceptance, selection-rate gaps, and total rollout cost.
Use predictive analytics for scale and forecasting, while keeping recruiters and hiring managers accountable for context and final decisions. Make any expansion conditional on measured results that justify the cost.
FAQs
How much hiring data do we need for reliable predictions?
You can start descriptive reporting with as few as 100 past hiring outcomes. For forecasts you can use to plan hiring, aim for at least two years (eight quarters) of hiring and departure data. This helps you account for seasonal patterns, hiring cycles, and performance review periods, while separating trends from one-off events.
Reliable forecasts depend on data quality and consistency, not just volume. That means clean, standardized records across your ATS and HRIS.
How can we validate predictions for rejected candidates?
Review rejected applications regularly with human oversight to catch unexplained exclusions or mismatches caused by resume formatting or unconventional backgrounds. Keep manual screening alongside automated tools so you don’t overlook qualified candidates [1][2].
Use structured, skills-based scorecards and independent reviewers to check assessments against AI recommendations. Investigate differences, document corrections, and retest the model to improve future prediction accuracy [1][2].
What if our pilot is faster but less fair?
Pause before expanding. Investigate the issue, review affected applications again, and retest. Predictive analytics should support human judgment, not replace it. Faster hiring only helps if quality and equitable treatment hold steady.
Before launch, define stop conditions and selection-rate thresholds, such as flagging protected-group selection rates below 80%. If unexplained disparities appear, do not move to full monitoring. Keep human review as the final gate.