Hiring without data is like flying blind. For SMEs, recruitment metrics are the key to hiring smarter, saving money, and avoiding costly mistakes. A bad hire can cost your business $15,000 to $50,000, and nearly 20% of new hires leave within 45 days. The solution? Use recruitment metrics to track what works and fix what doesn’t.
Key Takeaways:
- Cost per hire, time to fill, offer acceptance rate, and 90-day retention are the “Big Four” metrics every SME should track.
- Referrals outperform job boards: lower cost ($750 vs. $1,800) and higher retention (91% vs. 72%).
- Time to fill for SMEs should fall between 21–42 days, faster than the enterprise average of 44 days.
- Poor 90-day retention signals onboarding or role clarity issues, not just hiring problems.
Tracking the right metrics gives you control over hiring costs, improves retention, and ensures your recruitment process supports growth. If you’re struggling to track and act on these metrics, Rent a Recruiter can help you build a scalable hiring process that delivers measurable results.
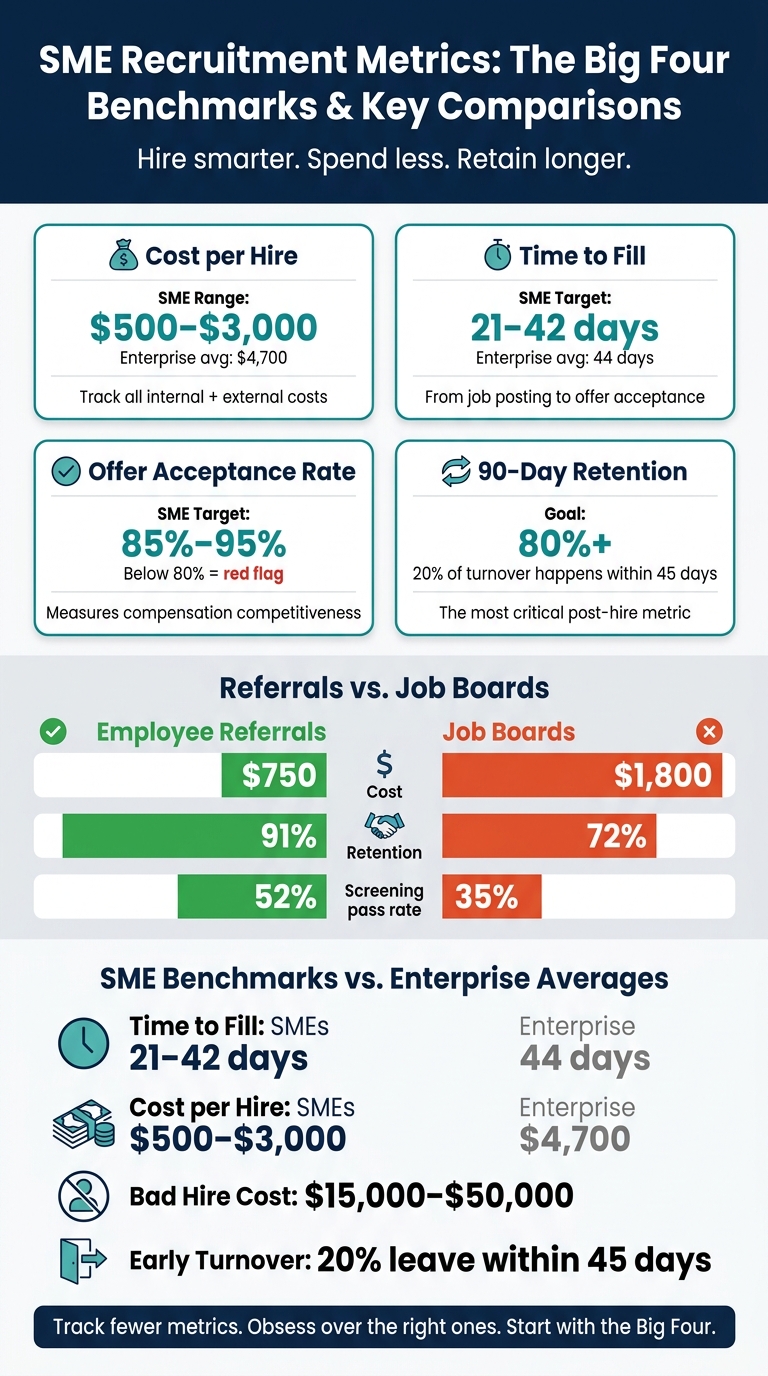
SME Recruitment Metrics: The Big Four Benchmarks & Key Comparisons
What Recruitment Metrics Are and Why They Matter
Defining Recruitment Metrics
Recruitment metrics are numbers that tell the story of how well your hiring process is performing. They measure aspects like efficiency, cost, quality, and overall outcomes of your talent acquisition efforts [1]. Think of them as a scoreboard that helps you evaluate and refine your approach to hiring.
These metrics fall into three main categories:
- Input: Tracks what you put into the process, such as spending on job boards, sourcing channels, or the number of applicants.
- Process: Focuses on how efficiently things move, like time to fill a role or how many candidates pass initial screenings.
- Outcome: Highlights the end results, such as offer acceptance rates, 90-day retention, or the quality of hire.
Understanding these categories is critical because solving issues in one area might require looking elsewhere. For example, if filling a role takes too long (a process issue), the root cause could be a lack of strong applicants (an input issue). This clarity helps businesses zero in on what needs fixing.
Why SMEs Need a Focused Set of Metrics
For small and medium-sized enterprises (SMEs), it’s essential to focus on metrics that directly drive decisions. Tracking too many numbers can lead to confusion and wasted effort. Instead, SMEs should concentrate on a handful of key metrics like cost per hire, time to fill, offer acceptance rates, and 90-day retention [1].
"The difference between tracking nothing and tracking four metrics is the difference between guessing and knowing." – FirstHR [1]
Each of these metrics impacts how you allocate your budget and design your hiring process. If a metric doesn’t help you make better decisions, it’s just noise.
Don’t stop measuring once an offer is accepted. Pre-hire metrics show how well your sourcing and screening efforts are working, while post-hire metrics confirm whether your investment in a new hire pays off.
sbb-itb-a23bd6a
Core Recruitment Metrics Every SME Should Track
Metrics by Funnel Stage
The hiring process is like a funnel, with candidates moving through stages from sourcing to onboarding. At each stage, specific metrics help identify where things might be going wrong.
| Funnel Stage | Key Metrics | What It Tells You |
|---|---|---|
| Sourcing | Source of Hire, Applicants per Opening | Which channels deliver quality candidates at the lowest cost |
| Screening | Application Review Time, Passthrough Rates | How efficiently your team filters candidates |
| Interviewing | Scheduling Lead Time, Scorecard Completion | Where delays and misalignment occur |
| Offer | Offer Acceptance Rate, Offer Turnaround | Whether your process is competitive at the closing stage |
| Post-Hire | 90-Day Retention, Time to Productivity | Whether the hire actually worked out |
For example, referred candidates have a 52% pass rate at the initial screening stage, compared to 35% for general applicants [3]. This stark difference highlights why it’s crucial to evaluate your sourcing channels and allocate budgets effectively. Metrics like these shine a light on which parts of your hiring process need attention.
How Each Metric Drives Business Outcomes
Each recruitment metric aligns directly with business results, offering insights that help small and medium-sized enterprises (SMEs) avoid costly hiring mistakes.
Source of Hire reveals where your recruitment budget is best spent. If referral hires consistently outperform other channels in quality and retention, it’s a clear sign to invest more in your employee referral program and scale back on less effective methods like paid job boards.
Time to Fill impacts how quickly your business can operate at full capacity. When roles sit open too long, the rest of your team feels the strain. For SMEs, a good benchmark is 21–42 days – much faster than the enterprise average of 44 days [1], thanks to fewer layers of approval.
Offer Acceptance Rate is a barometer for how competitive your compensation and candidate experience are. A strong rate for SMEs falls between 85% and 95% [1]. If your numbers are consistently lower, the issue often lies in either the offer itself or the time it took to extend it.
90-Day Retention is arguably the most critical post-hire metric. Around 20% of employee turnover happens within the first 45 days [1], and replacing an employee can cost between 30% and 50% of their annual salary [1]. As FirstHR aptly states:
"The most expensive recruitment failure is not a slow hire. It is a fast hire who quits in month two, forcing you to restart the entire process." [1]
These metrics aren’t meant to be viewed in isolation. For example, a high offer acceptance rate means little if your 90-day retention is poor. Similarly, a quick time-to-fill only adds value if the new hire stays and thrives. By tracking these metrics together, SMEs can get a full picture of their hiring health and make data-driven improvements.
How to Calculate and Monitor Recruitment Metrics
Formulas and Data Requirements
Tracking recruitment metrics is only helpful if the calculations are accurate and based on reliable data. Here’s a breakdown of key metrics, their formulas, and the information you’ll need:
| Metric | Formula | Data You Need |
|---|---|---|
| Time to Fill | Offer Acceptance Date − Job Posting Date | Posting date, acceptance date |
| Time to Hire | Offer Acceptance Date − Application Date | Application date, acceptance date |
| Cost per Hire | (Internal Costs + External Costs) ÷ Total Hires | Job board fees, recruiter time, referral bonuses, background checks |
| Offer Acceptance Rate | (Offers Accepted ÷ Offers Extended) × 100 | Total offers made vs. accepted |
| 90-Day Retention | (Hires Employed at Day 90 ÷ Total Hires) × 100 | Start date, termination date (if applicable) |
One metric that smaller businesses often underestimate is Cost per Hire. It’s easy to focus on external costs like job board fees or background checks, but internal costs – such as recruiter time, referral incentives, and hours spent by hiring managers in interviews – can add up quickly. Ignoring these factors gives a misleading picture of your actual hiring expenses.
If you don’t have access to an Applicant Tracking System (ATS), a spreadsheet can do the trick. Use a "one row per hire" approach: each hire gets its own row, and columns capture details like the candidate source, posting date, application date, offer date, acceptance date, total cost, and 90-day retention status. This setup is simple to maintain – spending about 5 minutes per hire ensures you have all the data you need for accurate metric calculations.
Once your data is in order, the next step is conducting a recruitment health check to ensure your team applies consistent definitions and follows clear processes.
Maintaining Consistency Across Metrics
The biggest challenge in tracking recruitment metrics isn’t the lack of tools – it’s inconsistent definitions. For example, if one recruiter starts measuring "Time to Hire" from the requisition approval date while another starts from the application date, comparisons across roles or time periods become unreliable.
To avoid confusion, align your team on when each metric begins and ends. Document these definitions in a shared file, often called a data dictionary, and ensure everyone – whether they’re in talent acquisition or finance – uses the same criteria. This is especially critical for metrics like Time to Fill and Cost per Hire, where interpretations can vary widely.
Equally important is maintaining clean data. Inconsistent tags, such as one recruiter listing a source as "LinkedIn" while another uses "LI", can quickly undermine your reporting. Standardize your labels and ensure stage transitions are recorded promptly to avoid the "garbage in, garbage out" problem that plagues many recruitment dashboards.
Lastly, don’t get distracted by industry benchmarks that may not reflect your reality. While the global average cost per hire is around $4,700, and the average time to hire is over 44 days, these figures are often irrelevant for SMEs. For smaller businesses, a realistic cost per hire typically ranges between $500 and $3,000, with time to fill falling between 21 and 42 days. The most valuable benchmark is your own historical data – track trends quarter over quarter to uncover patterns that matter for your business. To identify further gaps in your strategy, you can rate your recruitment process using our free analysis tool.
How to Interpret and Act on Recruitment Metrics
Reading Metrics in Context
Metrics only tell part of the story unless you consider the full picture. For example, a fast time-to-fill might seem like a win, but if 90-day retention is low, it points to deeper issues. Speed without quality often leads to costly turnover, forcing you to restart the hiring process.
Think of recruitment metrics as a balancing act between speed, cost, and quality. Focusing too heavily on one can compromise the others. For instance, skipping a structured interview to reduce time-to-fill might keep offer acceptance rates steady, but if 90-day retention drops, it’s a red flag worth investigating.
Your historical data is your best benchmark. Comparing this quarter’s metrics to the last can show whether you’re improving or falling behind. These insights help you home in on which parts of your hiring process need the most attention.
Using Metrics to Identify Bottlenecks
Hiring roadblocks often show up clearly in your stage-by-stage metrics. Tracking how long candidates spend at each stage can uncover where delays occur. For instance, if candidates move quickly from application to screening but then stall between the first and second interviews, it could signal internal issues like slow feedback or unavailable hiring managers.
Here’s a quick guide to common metric signals and their likely causes:
| Metric Signal | Likely Problem | Actionable Fix |
|---|---|---|
| High Time to Fill | Slow sourcing or approval bottlenecks | Streamline approval processes; expand sourcing efforts [1][2] |
| Low Screening Pass-through | Unclear job descriptions | Clarify "must-have" vs. "nice-to-have" criteria [2] |
| Low Offer Acceptance (below 80%) | Compensation or delays | Discuss salary earlier; reduce interview rounds [1][5] |
| Low 90‑Day Retention | Onboarding or role mismatch | Create a structured 30-day onboarding plan [1] |
| High Application Abandonment | Application process friction | Simplify forms; improve mobile usability [2] |
Breaking your analysis into pre-hire and post-hire phases can also provide clarity. Many small and midsize enterprises (SMEs) focus only on sourcing and hiring, often overlooking broader talent acquisition strategies, but onboarding issues can be just as costly. In fact, nearly 20% of employee turnover happens within the first 45 days [1].
Turning Insights into Actionable Changes
Once you’ve identified bottlenecks, it’s time to act. Patterns in your data can guide you to the right adjustments.
If your offer acceptance rate drops below 80%, the issue is often tied to uncompetitive salaries or a slow-moving process. Bringing up compensation earlier in interviews can prevent last-minute surprises and reduce candidate drop-off [1][5].
For 90-day retention, the problem usually lies in onboarding rather than sourcing. Review the first 30 days of the employee experience to ensure roles are clearly defined and new hires get the support they need.
When evaluating sourcing efficiency, compare the cost and retention rates of hires by channel. If referrals consistently deliver better results than job boards, it’s a clear sign to invest more in a formal referral program rather than spreading your budget evenly [1].
"The meta-principle: track what changes your next decision. If a metric does not tell you to do something differently, it is not worth tracking." – FirstHR [1]
For SMEs making fewer than 10 hires annually, reviewing metrics quarterly is often enough to spot trends without drowning in data. The aim isn’t to build a flawless dashboard – it’s to make smarter hiring decisions with every cycle.
Building a Recruitment Metrics Dashboard for SMEs
Essential Recruitment KPIs for SMEs
For most SMEs, four key metrics – cost per hire, time to fill, offer acceptance rate, and 90-day retention – provide a comprehensive view of the hiring process [1]. Often referred to as the "Big Four", these metrics measure efficiency, candidate experience, and whether the hires are meeting expectations.
Beyond these, tracking source of hire and quality of hire can offer deeper insights. For example, employee referrals tend to outperform job boards by 40% in terms of successful placements [6]. Quality of hire can be calculated by averaging three elements: the 90-day performance review score, hiring manager satisfaction (rated on a 1–5 scale), and a binary retention score [1].
"Quality of hire helps prevent trading speed for sustainability. Declining quality often signals rushed decisions, weak role clarity, or misaligned selection criteria." – AIHR [7]
Dashboard Layout and Review Cadence
Using consistent metric definitions is crucial for accurate tracking. A simple spreadsheet can often serve as an effective dashboard for SMEs. Each row represents a hire, grouped into four main categories: Basics (e.g., hire name, role, source), Pre-Hire (key dates), Costs (total spend), and Post-Hire (retention and performance markers) [1]. This setup requires minimal effort – just about five minutes per hire to update.
The frequency of dashboard reviews depends on hiring volume. For companies hiring fewer than 10 people annually, a quarterly 30-minute review is typically sufficient to identify trends [1]. For higher volumes, monthly reviews may be necessary. While leadership should focus on trends like cost and quality, hiring managers can address bottlenecks and evaluate source performance weekly [6].
| Review Frequency | Who Reviews | Focus Areas |
|---|---|---|
| Weekly | Hiring managers | Pipeline health, bottlenecks, source effectiveness |
| Monthly | HR/Operations lead | Cost per hire, time to fill, offer acceptance |
| Quarterly | Leadership | Quality of hire, retention trends, channel ROI |
Implementing a Required Fields Policy ensures that critical data – such as source attribution and stage dates – is recorded before a candidate progresses [6]. This keeps your dashboard accurate and actionable.
With a clear dashboard and regular reviews in place, you’re well-equipped to tackle recruitment challenges. Next, let’s explore how Rent a Recruiter can make this process even easier.
How Rent a Recruiter Can Help
Tracking recruitment metrics consistently can be a challenge for SMEs, especially when internal teams are juggling multiple responsibilities. This is where Rent a Recruiter steps in. By embedding experienced recruiters directly into your team, we ensure data hygiene and actionable insights from the start.
Instead of struggling with incomplete dashboards or reacting to unexpected spikes in time to fill, Rent a Recruiter provides a structured hiring process that captures meaningful data. The result? A hiring function that delivers measurable results. Clients often see up to 70% savings in hiring costs compared to traditional commission-based recruitment models, while reclaiming over 80 hours per month previously spent on admin tasks. These improvements directly impact metrics like cost per hire, giving you a clearer picture of your recruitment efficiency over time.
5 Key Recruitment Funnel Metrics to Boost Talent Acquisition
Recruitment Metrics by Growth Stage: What to Prioritize
Recruitment priorities evolve as your business grows. While the earlier sections covered essential recruitment metrics, their importance shifts depending on your company’s stage. Here’s how to adjust your focus as your team scales.
Metrics for Early-Stage SMEs
If you’re hiring between 5 and 20 people a year, simplicity is your best strategy. Stick to the basics: cost per hire, time to fill, offer acceptance rate, and 90-day retention. These four metrics give you a clear picture of your hiring effectiveness without overcomplicating things.
A simple spreadsheet can handle this stage. Each hire gets its own row – no need for complex systems yet. But pay close attention to 90-day retention, as 20% of employee turnover happens within the first 45 days [1]. If new hires leave quickly, it’s a red flag. The problem could lie in the job description, onboarding process, or even the hiring decision itself.
Another metric worth tracking early is source of hire. Referred candidates stand out – they pass initial screens at a rate of 52% compared to 35% for general applicants [3]. They also tend to cost less and stay longer. If referrals are outperforming job boards, you can shift your budget to maximise results.
Metrics for Scaling SMEs
As your hiring volume increases, the focus shifts from speed to consistency. Joel Westmark from Ashby explains:
"As hiring systems mature, the first improvement is not necessarily speed, but consistency." [3]
Once you hit around 100 employees, time to fill often stabilises, allowing for better headcount planning rather than scrambling to fill roles reactively.
At this stage, you’ll need to build on the core metrics. Start tracking time in stage, which measures how long candidates spend in each step of the hiring process. This helps identify bottlenecks in your pipeline. Combine this with metrics like scorecard completion rates and time to productivity to ensure faster hiring doesn’t sacrifice quality. As FirstHR points out:
"The most expensive recruitment failure is not a slow hire. It is a fast hire who quits in month two, forcing you to restart the entire process." [1]
To handle the increased complexity, upgrading your tools is essential. An Applicant Tracking System (ATS) becomes invaluable for managing multiple roles, keeping your data consistent, and ensuring visibility across the hiring pipeline.
| Metric | Early-Stage SME | Scaling SME |
|---|---|---|
| Primary goal | Fill roles quickly and cost-effectively | Achieve consistency and predictability |
| Core metrics | Cost per hire, time to fill, offer acceptance, 90-day retention | All core metrics plus time in stage, scorecard completion, time to productivity |
| Tooling | Spreadsheet | Applicant Tracking System (ATS) |
| Key complexity | Sourcing and screening | Scheduling, stakeholder alignment, process standardization |
While spreadsheets work fine for your first handful of hires, managing multiple roles simultaneously requires an ATS. Without a reliable system to centralise your data, your metrics lose accuracy, and your hiring process risks becoming inefficient.
Conclusion: Using Recruitment Metrics to Drive SME Growth
Recruitment metrics turn hiring into a precise, data-driven process, giving SMEs the tools to grow with confidence.
Key Takeaways for SMEs
It’s not about tracking every metric – it’s about focusing on the ones that matter. As Joseph Burns, Founder of Lupa, puts it:
"The best hiring teams track fewer metrics but obsess over the ones that predict long-term success." [4]
Start with the Big Four: cost per hire, time to fill, offer acceptance rate, and 90-day retention. These metrics provide a clear picture of your hiring challenges without overwhelming complexity. As your hiring needs expand, you can add metrics like source of hire to refine your strategy.
One common mistake SMEs make is prioritizing pre-hire metrics like speed and cost while neglecting post-hire data. This approach can lead to costly hiring mistakes – a bad hire can set you back as much as $50,000 [1]. Metrics like 90-day retention help ensure you’re not just hiring quickly but hiring well.
Your historical data is a better benchmark than generic industry averages. SMEs typically fill roles in 21 to 42 days at a cost of $500 to $3,000 per hire [1], significantly lower than the national enterprise average of $4,700 [4]. Aligning your metrics with your business goals is the key to improving hiring performance over time.
This targeted approach lays the groundwork for real, actionable improvements.
Start Optimizing Your Recruitment with Rent a Recruiter
Turn these insights into action with expert support. By narrowing your focus to the right metrics, you create a scalable hiring process that drives growth.
If your team doesn’t have the capacity to implement these changes, Rent a Recruiter can step in. Their embedded recruiters integrate directly into your team – often within days – bringing the structure, data expertise, and consistency needed to make your metrics work for you. Clients typically cut hiring costs by up to 70% and save over 80 hours per month on internal admin.
Whether you’re hiring your first 10 employees or scaling toward 100, getting your recruitment metrics right is a high-impact move for your business. Book a call with Rent a Recruiter to see how embedded recruitment can help you hire smarter and grow with confidence.
FAQs
What’s the difference between time to fill and time to hire?
Time to fill refers to the total number of days it takes from the moment a job requisition is approved or posted until an offer is accepted. It’s a metric that focuses on the overall efficiency of your internal hiring processes.
On the other hand, time to hire measures the period between when a candidate first enters the pipeline – whether by applying or being sourced – and when they accept an offer. This metric zeroes in on the speed of the candidate’s journey through the recruitment process.
In essence, time to fill captures the full hiring timeline, while time to hire zooms in on how quickly your recruitment process moves candidates from start to finish.
How do I track the Big Four metrics without an ATS?
Tracking the Big Four recruitment metrics – cost per hire, time to fill, offer acceptance rate, and 90-day retention – doesn’t require fancy software. A straightforward spreadsheet can do the job.
Log essential data such as dates, expenses, and outcomes for each hire. For example, calculate time to fill by counting the days between posting a job and receiving an accepted offer. Similarly, track hiring costs to determine cost per hire.
By consistently updating this spreadsheet, small businesses can keep a close eye on their recruitment performance without needing an applicant tracking system (ATS).
What should I fix first if my 90-day retention is low?
If your 90-day retention rate is struggling, it’s time to dig into the reasons behind early departures. Start by examining critical factors such as role clarity, onboarding effectiveness, managerial support, and alignment with company culture.
One effective approach? Run feedback surveys at key milestones – 7, 30, and 60 days into a new hire’s journey. These can uncover pain points like vague job expectations or inadequate onboarding experiences. Addressing these gaps not only helps new hires feel more supported but also reduces the expense and disruption of frequent re-hiring.