I judge recruitment savings by total cost and hiring outcomes, not a smaller monthly invoice. Start with a matched hiring baseline, then check whether your costs fall without longer vacancies or weaker retention. This requires comparing different recruitment models to ensure your baseline is accurate.
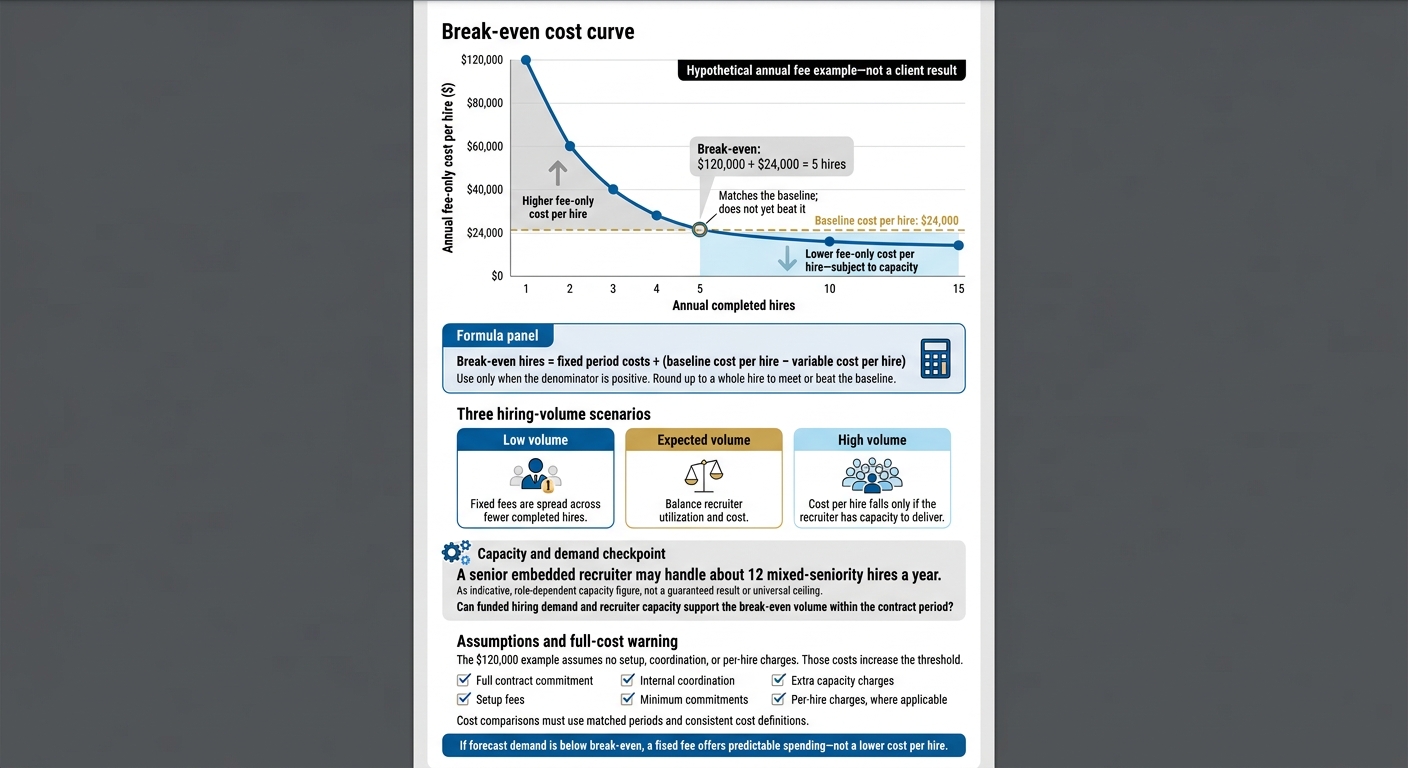
For example, $120,000 in annual fees needs five hires to match a $24,000 baseline cost per hire, assuming no other costs. That threshold only works if your hiring demand and recruiter capacity support it.
When assessing embedded recruitment, I check:
- Total cost per hire: Include fees, tools and internal staff time.
- Hiring volume: Test whether completed hires justify the fixed fee.
- Time saved: Separate released staff capacity from cash savings.
- Hiring speed: Count actual vacancy days avoided and document their cost.
- Retained-hire cost: Track 90-day, six-month and 12-month outcomes alongside performance.
Provider claims are not proof of your savings. I use a monthly dashboard to verify <u>lower costs, sufficient capacity and stable hiring outcomes</u> before adding recruitment support.
MUST-KNOW RECRUITMENT METRICS and ACTIONABLE INSIGHTS – Time to Fill, Cost per Hire, Acceptance Rate
sbb-itb-a23bd6a
How Hiring Volume Affects Fixed Monthly Costs
Embedded Recruitment Costs: Break-Even Hiring Volume
Once you have a cost-per-hire baseline, test how hiring volume changes what you pay for each completed hire.
A fixed monthly fee gives you predictable spending, but it doesn’t guarantee savings. Your cost per hire depends on completed hires, role mix, recruiter capacity, and contract terms. Include setup fees, minimum commitments, and extra capacity charges before treating the monthly fee as your total cost.
A senior embedded recruiter may handle about 12 mixed-seniority hires a year. Your hiring volume and role mix determine whether the fixed fee works out cheaper.[3]
Compare Low, Expected, and High Hiring Volume
At low volume, you spread the fixed fee across fewer hires. Expected volume balances recruiter utilization and cost. High volume lowers cost per hire only if the recruiter has capacity to deliver. Check that capacity against the roles you actually need to fill.
Then calculate the break-even volume to see when the fixed fee meets or beats your baseline.
Calculate Break-Even Hiring Volume
Use break-even hires = fixed period costs ÷ (baseline cost per hire − variable cost per hire) when you can separate those costs clearly.[3]
Fixed costs must include the full contract commitment, setup, and internal coordination. Use the formula only when the denominator is positive, then round up to a whole hire to find the volume needed to meet or beat your baseline.
Example: $120,000 in annual fees ÷ a $24,000 baseline cost per hire = 5 hires.[3]
This hypothetical example assumes no setup, coordination, or per-hire charges. Those costs increase the threshold.
Check whether funded hiring demand and recruiter capacity can support the required volume within the contract period. If forecast demand falls below that number, the fixed fee gives you predictable spending, not a lower cost per hire.
Recruiter Output, Hiring Speed, and Vacancy Costs
Track Recruiter Output and Internal Hours Saved
Once you’ve measured fixed-cost efficiency, check whether embedded recruitment increases hiring output and shortens vacancies. Track hires per recruiter per month, using the same completion point as your cost-per-hire baseline. Focus on time saved and hiring speed.
Compare matched role groups across equal reporting periods against a documented 3-6-month baseline. Match seniority, location, role family, compensation range, and hiring difficulty.
Record hiring-manager hours spent on requirements, candidate reviews, interviews, scheduling, feedback, and offers. Check essential recruitment metrics like offer acceptance, start rates, and 90-day retention alongside speed. Faster hiring should not come at the expense of hiring quality.
Calculate hours released = per-hire time difference × comparable hires. Use weekly time logs or workflow timestamps rather than estimates from memory.
Report reassigned time as capacity released, not payroll savings. Only count avoided overtime or contractor payments as cash savings. Higher recruiter output matters when it reduces vacancy days and the cost of leaving roles unfilled.
Measure Hiring Speed and Avoided Vacancy Costs
Track time-to-fill, time-to-hire, and offer-to-start in calendar days. Report medians and ranges, but calculate vacancy savings from actual vacancy days. Don’t multiply a median by hiring volume.
For each role group, calculate avoided vacancy cost = actual days saved × documented daily impact. Keep paid coverage expenses separate from opportunity costs. Avoid counting overtime, lost capacity, or manager hours twice.
Earlier offers don’t always mean earlier starts. If start dates stay the same, vacancy savings may be zero.
Use the table as a role-matched illustration, not proof of results. Account for other process changes before attributing savings to embedded recruitment.
Hypothetical comparison – not a client result. These illustrative assumptions cover 20 matched nonexecutive roles. The vacancy calculation assumes each role closes 14 days earlier and starts equally sooner, producing 280 fewer vacancy days. The $300 daily impact should be supported by company records; if it reflects opportunity cost rather than an actual expense, label it accordingly.
Metric Baseline recruiting process Embedded recruitment process Difference Business impact Completed hires 20 20 – Same hiring volume Median time-to-fill 56 days 42 days 14 days Vacancy time reduced Total vacancy days assumed 1,120 840 280 fewer days Basis for vacancy-cost calculation Daily vacancy impact $300 $300 – Separate documented expenses from opportunity costs Vacancy-cost estimate $336,000 $252,000 $84,000 avoided Not cash savings without an expense breakdown
Retained-Hire Costs and Evidence Limits
Flexible Embedded Recruitment and lower vacancy costs pay off only if new hires stay long enough to deliver value.
Calculate Cost per Retained Hire
Group hires by start month or quarter. Calculate cost per retained hire as total cohort recruiting costs ÷ hires still employed at the milestone.
Track 90-day, six-month, and 12-month results separately. Include only cohorts that have had enough time to reach each milestone.
| Metric | Numerator | Denominator | Limitation |
|---|---|---|---|
| Cost per retained hire | Total recruiting costs for the cohort | Hires still employed at 90 days, six months, or 12 months | Excludes the financial impact of vacancies left by departing hires |
| Retention-adjusted cost | Cohort recruiting costs + replacement costs + vacancy costs | Hires still employed at the selected milestone | Requires detailed tracking of internal hours and productivity loss |
For retention-adjusted cost, include replacement sourcing, interviews, and hiring-manager hours linked to the original departure. This gives you a clearer view of what those departures cost your business.
Pair retention with post-hire performance and hiring-manager satisfaction. Staying in the role does not, on its own, prove hire quality.
Review Research and Provider Claims
Rent a Recruiter reports up to 70% lower hiring costs compared with conventional agency fees and more than 80 internal hours saved per month.[1] These figures are provider-reported, not independently verified.
Compare retained-hire costs for similar roles. Account for hiring volume, compensation, role difficulty, and recruiter allocation so that differences in hiring demand do not distort your comparison.
Lower recruiting spend only tells part of the story. Check that retention and performance remain comparable, and assess retained-hire cost alongside hiring speed and vacancy data when evaluating the model’s efficiency.
Conclusion: Build a Hiring Cost Measurement Plan
Set a Baseline and Monthly Dashboard
Turn the metrics from earlier sections into a monthly decision tool. Embedded recruitment is cost-efficient when total recruiting cost falls without slowing hiring or weakening retention.
Use hiring volume and role difficulty to assess whether fixed-fee support fits your demand. Compare the monthly fee with completed hires. Cost per hire falls as you spread the fee across more hires, provided the workload stays within recruiter capacity. Segment results by role difficulty.[3]
Track the metrics that directly affect cost per hire, speed, and retention.
| Metric | Monthly reporting line | Change to report | Data limit |
|---|---|---|---|
| Total recruiting cost and cost per hire | Total spending, internal labor, and completed hires | Dollar and percentage change | Missing labor costs understate totals |
| Capacity utilization | Hires completed and recruiter capacity used | Output relative to available capacity | Capacity varies with role difficulty |
| Internal workload | Hours spent on sourcing, screening, interviews, and administration | Hours saved or added | Estimated hours need validation |
| Hiring speed | Engagement-to-go-live, shortlist delivery, and final placement | Days and stage timing | Results vary with role complexity |
| Retention and retained-hire cost | 90-day, 6-month, and 12-month retention and retained-hire cost | Retention and cost changes | Use consistent cohort definitions |
Verify Savings Before Adding Capacity
Lower spending is a signal to investigate, not proof of savings. Keep cost definitions consistent and separate direct spending from estimated opportunity costs.[2] Record missing data and assumptions. You can also rate your recruitment to identify other hidden inefficiencies. Check performance and hiring-manager feedback before treating a cost reduction as an improvement.
Test low, expected, and high hiring-volume scenarios against the proposed fee and recruiter allocation.[2][3] Before-and-after results show correlation, not causation.[2][3]
Set your baseline and review the dashboard monthly. Add capacity only when the data confirms lower total cost, sufficient capacity, acceptable hiring speed, and stable retention and retained-hire cost.
FAQs
Can embedded recruitment stay cost-efficient if hiring demand drops?
Yes. Embedded recruitment lets you scale hiring support up or down without long-term commitments or rigid contracts.
Unlike permanent in-house staff with fixed salaries and benefits, this pay-as-you-need model ties your recruitment spending to current hiring demand. You avoid paying for unused capacity when hiring slows, as well as the high, unpredictable commission fees charged by recruitment agencies.
How can I isolate savings caused by embedded recruitment?
Set a baseline for total hiring spend and cost per hire over a fixed period. Include recruitment expenses, the daily cost of unfilled roles multiplied by the number of days they remain open, and administrative hours multiplied by a fully loaded hourly rate.
Compare that baseline with your embedded partner’s fixed monthly cost. Track avoided recruitment expenses, shorter time-to-fill, and reduced administrative overhead to measure the financial impact.
How should I evaluate savings before retention data is available?
Start with a recruitment cost baseline: agency fees, internal salaries, job board spending, and ATS licenses. Run a 3- to 6-month pilot to compare your current cost per hire with the embedded recruitment model’s fixed monthly cost.
Track vacancy costs, internal hours saved, time-to-fill, and resume-to-interview ratios. Value the hours saved at a fully loaded hourly rate so you can measure direct savings, less repeat work, and faster hiring.