We hold recruitment vendors accountable by measuring hiring speed, total cost, and results after the hire, not just the number of submissions. Start with four to six agreed metrics, compare similar roles, and assign an owner to each missed target.
We recommend tracking:
- Speed and delivery: Time-to-fill, fill rate, and stage conversion to spot delays that leave teams short-staffed.
- Total cost: Vendor fees plus internal recruiting time to see what each hire actually costs.
- Hiring outcomes: Performance and retention at 90, 180, and 365 days to check whether hires meet your needs.
Fast hiring alone does not prove a good hire. Use <u>the same definitions and reporting periods</u> for every vendor, separate employer delays from vendor issues, and end each review with a clear action.
Here’s how we turn those measures into a scorecard that helps you control spending and improve hiring results.
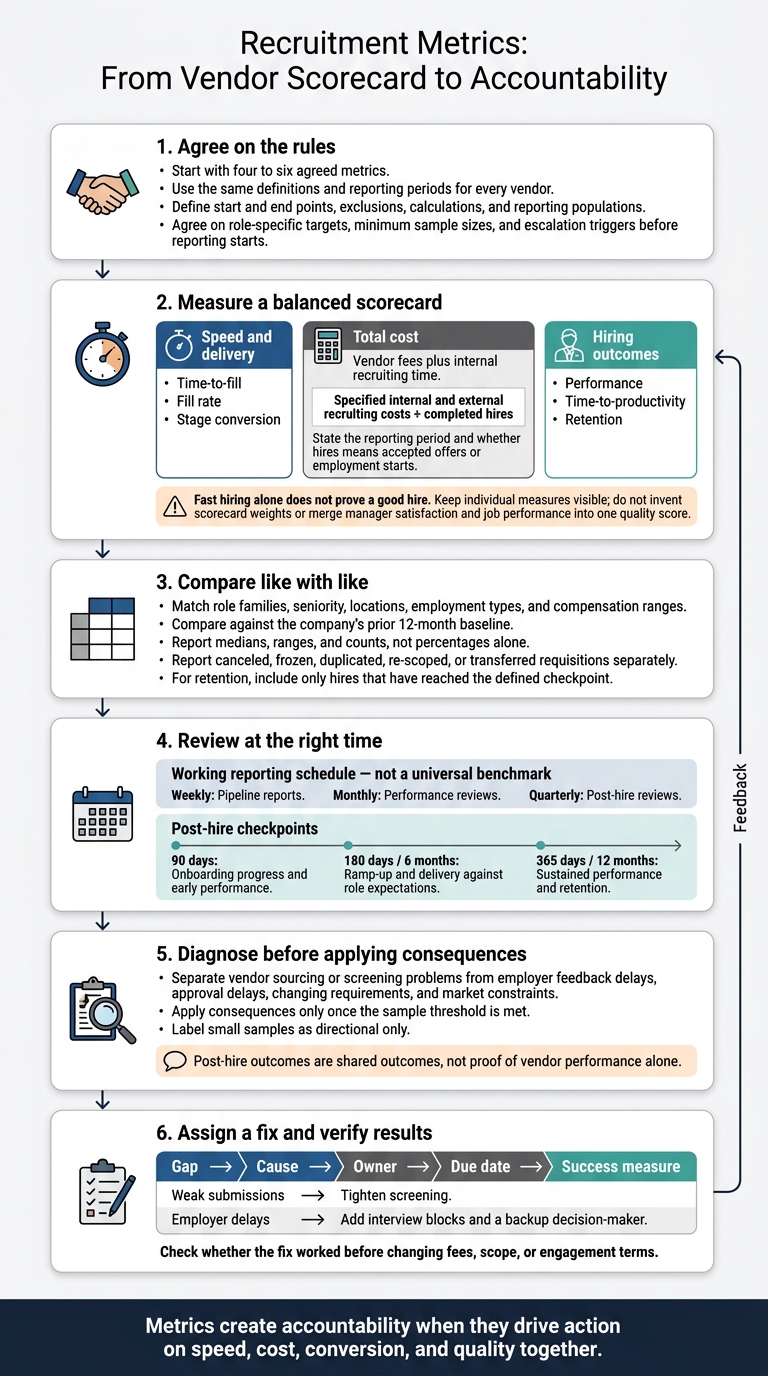
Recruitment Metrics: From Vendor Scorecard to Accountability
What Research Shows About Recruitment Performance
Hiring Speed and Cost Do Not Prove Quality
A 2025 study reported average turnover of 23% where time-to-fill exceeded 45 days, compared with 14% where it was under 30 days. It also found a strong negative association between quality of hire and turnover (r = -0.71).[7][10]
These figures show associations, not cause and effect. Faster recruiting does not necessarily lead to better retention. Compensation, management, onboarding, and role difficulty could explain part of the relationship. To use these findings when assessing vendors, you need metrics measured the same way.
SHRM’s 2026 recruiting benchmark reports a median time-to-fill of 39 calendar days for nonexecutive positions.[4] Treat this as a reference, not a quality target. Compare it with similar roles and your internal baseline, using shared definitions for every metric vendors report.
Measure quality after the hire starts, using defined checkpoints for performance, time-to-productivity, and retention. Six- and 12-month checks show outcomes that offer acceptance alone cannot.[5][9][11]
Use Consistent Definitions to Compare Results
Require the formula behind every reported result. SHRM measures time-to-fill in calendar days, including weekends and holidays.[8] Vendors should use the same start dates, stage rules, cost categories, and treatment of paused requisitions. Without matching formulas and time windows, you cannot make a like-for-like comparison.
| Metric | Definition and use | Measurement window | Main limitation |
|---|---|---|---|
| Time-to-fill | Requisition approval to accepted offer; measures duration | Per requisition; quarterly review | Approval rules, holds, and role difficulty affect results |
| Time-to-hire | Defined candidate start point to accepted offer; measures process speed | Per hired candidate | Different start points hide different delays |
| Fill rate | Filled requisitions ÷ assigned requisitions; measures delivery | Quarterly requisition set | Canceled or frozen roles can distort the denominator |
| Stage conversion | Candidates moving forward ÷ candidates entering the stage; identifies bottlenecks | Same requisition set | Stage standards and small samples affect comparisons |
| Cost-per-hire | Specified internal and external recruiting costs ÷ completed hires; measures spending | Quarterly or trailing 12 months | Missing labor, technology, or fee costs understate total cost |
| Quality and retention outcomes | Predefined performance, manager assessment, ramp-up, and retention measures | Six- and 12-month checkpoints after start | Unequal follow-up and manager ratings weaken comparisons |
Methodology note: Match role families, seniority, locations, employment types, and compensation ranges against your company’s prior 12-month baseline. Report medians, ranges, and counts, not percentages alone, so differences in hiring demand do not mislead your vendor assessment.
Apply documented exclusion rules. Report canceled, frozen, duplicated, re-scoped, or transferred requisitions separately. For retention measures, include only hires who have reached the defined checkpoint.
Use these definitions as the inputs for the vendor scorecard in the next section.
sbb-itb-a23bd6a
Top 10 Vendor Management KPIs to Track
Build a Balanced Vendor Scorecard
Use those definitions to compare vendors against the same weighted outcomes. Weight speed, funnel conversion, quality, and cost according to your hiring priorities, not submission volume. Keep each measure visible so fast hiring cannot hide poor post-hire results.
Set targets by role: senior engineering searches may need more time and stricter skill-match criteria; customer-support hiring may prioritize fill rate, offer acceptance, and 90-day retention.[12][13]
| Metric | What it shows | Required data | Risk of using it alone |
|---|---|---|---|
| Time-to-fill | Time to an accepted offer | Requisition approval date, offer-acceptance date, role, and seniority | Can reward rushed hiring or reflect employer approval delays |
| Time-to-hire | Hiring speed once sourcing starts | Candidate-entry point, offer-acceptance date, and stage timestamps | Can overlook time spent waiting for sourcing or requisition approval |
| Fill rate | Share of searches completed | Assigned-search cohort; filled, open, canceled, paused, and withdrawn statuses | Can favor easier roles unless cohorts are comparable |
| Submission-to-interview conversion | Shortlist relevance and screening discipline | Valid submissions and interview counts | Employer screening capacity can distort results |
| Interview-to-offer conversion | Alignment with selection criteria | Interview and offer records | Inconsistent interviewer standards affect results |
| Offer-acceptance rate | Compensation alignment and closing | Offers, acceptances, declines, and reasons | Pay and employer decisions influence outcomes |
| Post-hire quality and retention | Fit, performance, and staying power | Structured ratings, ramp-up measures, and retention checkpoints | Results take longer to arrive and depend partly on the employer |
| Cost-per-hire | Total recruiting cost per hire | Complete recruiting costs and hire count | Low spending can hide poor delivery |
Track Hiring Time, Fill Rate, and Conversion
Measure time-to-fill from requisition approval to offer acceptance. For time-to-hire, use one fixed candidate-entry point. Report calendar-day medians and ranges by role and seniority so comparisons reflect the roles you need to fill.
Track fill rate using the same assigned-search cohort through a stated cutoff. Disclose unresolved and canceled searches rather than removing them from the figures.
Apply consistent rules for submissions, screens, interviews, offers, and acceptances. Show stage durations alongside conversion rates to separate vendor screening problems from employer feedback delays.[6][16][17] This helps you locate funnel problems before judging cost or quality.
Assess Candidate Quality and Post-Hire Results
Assess candidates against documented skills, level, compensation alignment, and role fit. Keep hiring-manager satisfaction separate: it measures views of the process, not job performance. Do not combine these measures into a single quality score.[13][15]
At 90 days, assess onboarding progress and early performance. At 6 months, review ramp-up and delivery against role expectations. At 12 months, check sustained performance and retention.
Compare similar hiring cohorts. Before judging vendor performance, document employer factors such as challenges in recruitment, including changing requirements, feedback speed, onboarding support, and management. These are shared outcomes, not proof of vendor performance alone.[11][13][15]
Calculate Cost-per-Hire With Complete Costs
Calculate total internal and external recruiting cost per hire for the stated period, in U.S. dollars. State whether “hires” means accepted offers or employment starts.
Include fees, sourcing, advertising, assessments, background checks, and trackable internal labor. Disclose any exclusions. Assign direct costs to their searches and allocate shared costs using a documented rule.
For example, allocate shared costs by recruiter hours.
Track costs for open, canceled, and withdrawn searches separately. Review total spend per assigned search and completed hires alongside cost-per-hire, delivery, and retention.[12][14][17] Before changing vendor terms, check whether lower costs come with slower hiring or weaker retention.
Turn Vendor Reports Into Corrective Actions
Once your scorecard is set, rate your recruitment process and use clear reporting rules to turn missed targets into specific fixes.
Set Data Rules and Review Schedules
Create a shared metric dictionary that defines start and end points, exclusions, calculations, time zones, source attribution, and reporting populations. Before scoring performance, reconcile vendor, ATS, and HRIS records by requisition and candidate ID.
Use weekly pipeline reports, monthly performance reviews, and quarterly post-hire reviews as a working schedule, not a universal benchmark.[1][18] Agree on role-specific targets, minimum sample sizes, and escalation triggers before reporting starts.
| Metric | Frequency | Accountable owner | Escalation trigger |
|---|---|---|---|
| Time-to-fill | Monthly | Recruiting lead | More than 15% above target for two consecutive monthly cohorts |
| Fill rate | Monthly | Recruiting lead | Below target for two consecutive months |
| Interview-to-offer conversion | Monthly | Recruiting lead | Below the agreed range for two comparable cohorts |
| Employer feedback turnaround | Weekly and monthly | Hiring manager | More than 10% of decisions take over two business days |
| Fully loaded cost-per-hire | Monthly; quarterly reconciliation | Finance lead | More than 15% above the approved budget |
| Candidate quality | Monthly | Hiring manager | Quality threshold missed for two consecutive cohorts |
| 90-day retention | Quarterly | HR lead | Below target after the minimum cohort size |
| Post-hire performance | Quarterly | Hiring manager | Median result below the role benchmark |
| Data completeness | Weekly and monthly | Recruiting operations lead | Below 95% completeness or any compliance gap |
Diagnose the miss before applying penalties or changing the contract.
Investigate Gaps Before Changing Vendor Terms
For each missed target, record the gap, cause, owner, due date, and success measure. Trace the result back to the hiring process. Separate sourcing or screening problems from late feedback, approval delays, changing requirements, and market constraints.
Match the fix to the cause: tighten screening for weak submissions; add interview blocks and a backup decision-maker for employer delays.
Agree on scorecard weights before reviewing results. Keep each measure visible so speed cannot hide weak quality.
Apply consequences only once the sample threshold is met. Show counts alongside percentages, and label small samples as directional only. Compare matching cohorts and post-hire intervals. Then check whether the fix worked before changing fees, scope, or engagement terms.
Use the same scorecard when recruiting capacity sits inside your team.
Apply the Scorecard to Rent a Recruiter
With Rent a Recruiter, embedded recruiters inside client teams manage hiring end to end. Assign the recruiter ownership of pipeline records and follow-up actions, hiring managers ownership of decisions, and HR ownership of post-hire outcomes. Assess the engagement with the same speed, cost, quality, and post-hire metrics.
Conclusion: Define Metrics Before Scaling Hiring
Agree on four to six shared metrics to decide whether to scale hiring or address vendor performance[19][20]. Set baselines by role family and seniority using recent, comparable hires. Include internal recruiting time in cost-per-hire, and give one person ownership of reporting[2]. Review those baselines at fixed checkpoints after each hire.
Check quality at 90, 180, and 365 days, assessing early retention, performance, and time to productivity as cohorts mature. Use each checkpoint to identify whether the vendor, hiring team, or process needs to change by performing a recruitment health check. End every review with a decision or corrective action. If results miss the target, change the process rather than add more reporting.
Metrics create accountability when they drive action on speed, cost, conversion, and quality together. Before scaling, compare similar roles and cohorts with enough time on the job to assess results. For embedded recruiter support and a defined reporting cadence, contact Rent a Recruiter.
FAQs
How can we assess vendors with only a few hires?
Use a simple spreadsheet with one row per hire to record candidate source, dates, costs, and 90-day retention. Track four metrics: cost per hire, time to fill, offer acceptance rate, and 90-day retention.
If you make fewer than 10 hires a year, a 30-minute quarterly review is typically enough to spot trends. Track consistently, and you can hold vendors accountable without complex systems.
How should we weight our recruitment metrics?
Weight recruitment metrics against your top three business goals for the year. Prioritize the measures that matter, rather than tracking every data point. If quality is your focus, give more weight to 90-day retention and hiring manager satisfaction [1].
Use a weighted scoring model to keep assessments consistent across reviewers. Document who owns each criterion and the evidence supporting it [2][3]. Measure outcomes, not just activity, and use rolling averages covering at least 90 days to separate temporary setbacks from systemic issues [1].
What if our vendor disputes the scorecard?
Keep the discussion grounded in data, not opinions. Share the scorecard at least one week before the review meeting so the vendor has time to prepare.
Ask the vendor to explain the root causes of any discrepancies. Then agree on a corrective action plan with clear milestones and deadlines.
Document each step so you can hold the vendor accountable and keep the review focused on objective metrics.