If you are not tracking hiring with hard numbers, you are flying blind on cost, speed, and first-year retention.
I’d keep this simple. Recruitment KPIs tell you if your hiring process is too slow, too expensive, or bringing in people who do not stay. For scaling companies, that matters fast. SHRM puts average U.S. cost per hire at $4,700 and average time to fill at 42 days. If those numbers drift the wrong way, your teams lose output, managers lose time, and growth slows.
Here’s the short version:
- Track a small scorecard, usually 5 to 7 KPIs
- Measure both speed and outcomes, not just one side
- Map each KPI to a funnel stage so you can see where hiring breaks
- Use shared formulas and one owner per metric so reporting stays clean
- Review funnel metrics monthly and post-hire numbers quarterly
- Judge hiring in balance, not in isolation: speed, spend, and hire quality
The guide breaks down the KPIs that matter most, including time to hire, cost per hire, offer acceptance rate, conversion rates, quality of hire, first-year attrition, and onboarding completion. It also shows how to use those numbers to cut waste, save time, and improve hiring results across SaaS, Technology, IT, Fintech, Engineering, Security, Insurance, and Professional Services.
If you want more control over hiring delivery, Rent a Recruiter can place an experienced recruiter into your team and help you build a process you can measure and steer.
The Ultimate Guide to Talent Acquisition KPIs (Cost, Quality, Speed & More)
sbb-itb-a23bd6a
Building a recruitment KPI framework
Track only the KPIs you’ll review and act on.
Choose the right KPIs for your hiring stage
For most SMEs, five to seven KPIs is the sweet spot. That gives you enough visibility to spot issues without drowning your team in reports no one uses.
A practical starting scorecard for a lean HR or leadership team should cover the numbers that shape hiring speed, spend, and outcomes. That usually includes time to hire for process speed, cost per hire for spend control, offer acceptance rate for pay and process competitiveness, source of hire to show which channels are producing candidates, quality of hire to track performance, productivity, and retention in the first year, and retention rate to show whether new hires are working out.
Add metrics only when they change decisions. If a KPI doesn’t help you cut cost, save time, or improve hiring results, it’s just noise.
Map KPIs to each stage of the hiring funnel
The value of a KPI framework is simple: it shows you where the funnel breaks. Each KPI should sit against the stage where it gives the clearest signal.
| Funnel Stage | Key KPI | What It Tells You |
|---|---|---|
| Sourcing | Source of Hire | Which channels produce candidates |
| Application | Application Completion Rate | Where applicants drop off (target: 80% to 90%) [1] |
| Screening | Interview-to-Offer Ratio | How well screening narrows the pool (target: 3:1) [1] |
| Offer | Offer Acceptance Rate | Whether the offer is competitive (target: >90%) [1] |
| Hire | Time to Fill / Cost per Hire | Overall speed and budget efficiency |
| Post-Hire | Quality of Hire / Retention Rate | Whether hires perform and stay (target: >85% after year one) [1] |
This is where the framework starts to pay off.
If your offer acceptance rate is strong but time to hire is slow, the bottleneck sits earlier in the process, most likely in screening or scheduling. If sourcing looks healthy but application completion is low, the application flow may be too long or too complicated. Funnel-level visibility helps you separate the symptom from the cause, so you fix the right problem first.
Standardize formulas, data sources, and ownership
Metrics only work when everyone is measuring the same thing.
For example, time to fill runs from job posting to accepted offer. Time to hire runs from first application to accepted offer. That difference matters. If your leadership team uses those terms loosely, your reporting gets messy fast.
Set shared definitions, use calendar days for all time-based metrics, and keep cost metrics in USD. Pull data from steady sources: your ATS for funnel and sourcing data, your HRIS for retention and attrition, and performance reviews for quality of hire. Then assign one owner to each KPI so definitions, inputs, and reporting stay consistent.
With that framework in place, you’re in a much better position to rate your recruitment performance and use KPI data to spot bottlenecks.
Core recruitment KPIs to track
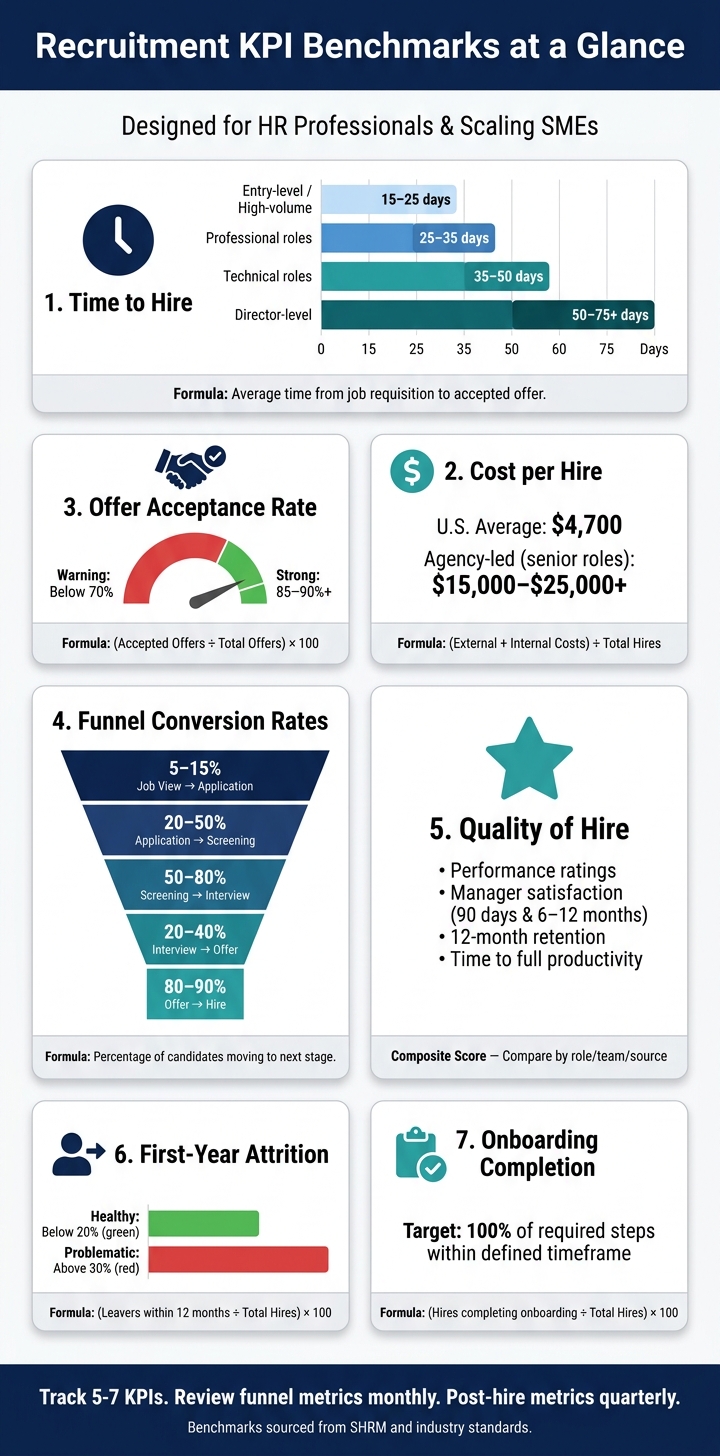
Recruitment KPI Benchmarks: Speed, Cost & Quality at a Glance
Use the funnel map from the previous section to read each KPI in context.
Time to hire, cost per hire, and offer acceptance rate
These three KPIs tell you three simple things: how fast you hire, what you spend, and how strong demand is for your roles.
Time to hire is the number of calendar days from public job posting to accepted offer. Work it out by averaging all filled roles in the period. Benchmarks change by role type: 15 to 25 days for high-volume or entry-level roles, 25 to 35 days for professional roles, 35 to 50 days for technical roles, and 50 to 75+ days for director-level searches.[1]
This metric matters because long hiring cycles do more than slow growth. They add manager time, stretch teams, and increase the risk of losing people you want before you get to offer stage.
Cost per hire is total recruitment spend divided by total hires, shown in USD. SHRM puts the U.S. average at about $4,700 per hire[1], but agency-led hiring can push that up to $15,000 to $25,000+ for senior or hard-to-fill roles. Include external costs such as job boards, ads, agency fees, and background checks. Then add internal costs like recruiter time, hiring manager time, and ATS licensing.
If you do not track the full number, you will understate what hiring is costing the business. For CFOs and CEOs, this is where recruitment shifts from an HR activity to a spend line that needs control.
Offer acceptance rate is worked out as (accepted offers ÷ total offers extended) × 100. 85% to 90% is strong. Below 70% usually points to pay, process, or closing issues. When acceptance rates fall, a short debrief with candidates who declined can help surface the real reason, whether that is pay, timing, or competing offers.[1]
A weak acceptance rate often means the problem is not sourcing. It is what happens later, how the role is sold, how long the process takes, and whether your offer lands well against the market.
Funnel conversion rates by stage
Conversion rates show where candidates drop out of the process. The formula stays the same at each stage: (candidates who advance ÷ candidates in the current stage) × 100.
| Funnel Stage | Healthy Conversion Range | What Low Conversion Usually Means |
|---|---|---|
| Job view → Application | 5–15% | Poor targeting, weak job ad, or friction in the apply flow |
| Application → Screening | 20–50% | Requirements are too strict or sourcing is off-target |
| Screening → Interview | 50–80% | Misalignment between recruiter and hiring manager on the ideal profile |
| Interview → Offer | 20–40% | Inconsistent scoring, too many unstructured interviews |
| Offer → Hire | 80–90% | Pay, timing, or competing offers pulling candidates away |
This is where a lot of hiring teams miss the point. They look at the funnel as one big number and then wonder why hiring feels slow or expensive. But each stage tells a different story.
A low job view to application rate usually points to targeting or job ad issues. A low application to screening rate often means the brief is too tight or sourcing is missing the mark. A low screening to interview rate tends to show a gap between the recruiter and hiring manager on what good looks like. A low interview to offer rate usually means process issues, poor scorecards, or too many unstructured interviews.
When you split the funnel properly, you can fix the right problem instead of guessing.
Quality of hire, first-year attrition, and onboarding completion
Post-hire metrics close the loop. They show whether people stayed, ramped up, and performed. The first three KPIs above focus on process efficiency. These next three focus on hiring outcomes.
Quality of hire is a combined score built from four inputs: hiring manager satisfaction at 90 days and 6 to 12 months, early performance ratings or OKR attainment, 12-month retention, and time to full productivity. In practice, this works best as a weighted scorecard that combines performance, manager satisfaction, retention, and time to productivity.
This KPI takes more effort to track, but it gives you a much better read on whether your hiring process is producing people who perform well, not just people who accept offers.
First-year attrition is the percentage of new hires who leave within 12 months, split between voluntary and involuntary exits. It can be worked out as (number of employees hired in the last 12 months who left within 12 months ÷ total number of employees hired in that same 12-month period) × 100. Below 20% is generally healthy. Above 30% points to a selection or onboarding issue.
When voluntary attrition is high in year one, the issue is often expectation mismatch. In plain English, what was sold in the interview process did not match the job people walked into.
Onboarding completion measures the percentage of new hires who finish a defined set of onboarding steps within a target timeframe, such as compliance training, system access, and 30/60/90-day milestones. It can be worked out as (number of new hires who complete all required onboarding steps within the target timeframe ÷ total number of new hires in that timeframe) × 100.
This metric is easy to overlook, but it matters. If onboarding is patchy, time to productivity stretches out, manager frustration climbs, and early attrition often follows.
| KPI | Formula | U.S. SME Benchmark | Business Use |
|---|---|---|---|
| Time to Hire | Sum of days from posting to accepted offer ÷ Total hires | 15–75+ days, depending on role | Flags process delays and candidate experience issues |
| Cost per Hire | (External + Internal costs) ÷ Total hires | ~$4,700 average; $15,000–$25,000+ with agencies | Controls spend and informs channel strategy |
| Offer Acceptance Rate | (Accepted offers ÷ Total offers) × 100 | 85–90% is strong | Signals compensation competitiveness and process quality |
| Stage Conversion Rate | (Candidates advancing ÷ Candidates in stage) × 100 | Varies by stage (see table above) | Pinpoints funnel bottlenecks |
| Quality of Hire | Composite of performance, manager satisfaction, retention, and time to productivity | No single benchmark; compare by role, team, or source | Validates selection criteria and sourcing channels |
| First-Year Attrition | (Leavers within 12 months ÷ Total hires) × 100 | Below 20% is generally healthy; above 30% is problematic | Reveals hiring and onboarding gaps |
| Onboarding Completion | (Hires completing required onboarding steps ÷ Total hires) × 100 | Completion of required onboarding steps within the defined timeframe | Connects onboarding quality to retention outcomes |
Next, use these KPIs to find the bottleneck, then rebalance speed, cost, and quality. With the core metrics defined, the next step is spotting where the funnel slows, leaks, or becomes too expensive.
Using KPI data to improve hiring performance
Find bottlenecks in the recruitment funnel
Use the metrics from the last section to spot where candidates stall, then fix that stage first.
The best way to improve hiring is to look at each funnel stage on its own. Low application volume usually points to a sourcing issue. Use source-of-hire data to cut weak channels and put more budget into the ones that deliver. If completion drops below your benchmark, shorten the form and remove friction.
Slow movement from screening to interview often comes down to scheduling delays or slow feedback. Set a 24 to 48 hour hiring manager SLA so good people do not sit in limbo.
| KPI Pattern | Likely Root Cause | Recommended Action |
|---|---|---|
| Low application completion rate | Application process is too long or complex | Simplify forms; remove unnecessary steps |
| High volume, low interview conversion | Poor candidate screening or vague job descriptions | Refine screening criteria; align with the hiring manager on must-have skills |
| Low interview-to-offer conversion | Weak initial screening | Tighten shortlist criteria before interviews |
| Long time to hire | Bottlenecks in interview scheduling or slow stakeholder feedback | Use feedback SLAs and track in an ATS |
| Low offer acceptance rate | Uncompetitive salary, benefits, or poor employer brand | Benchmark compensation and review candidate feedback surveys |
| High first-year attrition | Poor onboarding or role misalignment | Improve onboarding and make sure job descriptions reflect daily reality |
Once you know the bottleneck, test the fix and check the impact. Faster is only useful if hiring quality stays intact.
Balance hiring speed, cost, and quality
Time to hire and cost per hire only tell part of the story. They matter if quality and retention stay strong. A low cost per hire stops looking efficient when first-year retention drops below 85% [1].
Before you change sourcing spend or redesign interviews, compare cost per hire against quality of hire and first-year retention. If retention is weak, the issue is more likely onboarding or role fit than sourcing.
Speed works the same way. If you compress the process to improve time to hire, you can weaken screening. That often shows up later in poor performance or early exits. For scaling companies, the aim is simple: keep speed, cost, and quality in balance so hiring helps growth instead of creating churn and backfill cost.
Build a reporting rhythm that drives action
KPI data only matters if someone reviews it on a set cadence and does something with it.
Review funnel metrics monthly and post-hire metrics quarterly. That gives you enough data to spot patterns without overreacting to one hard-to-fill role or one slow month. Assign one owner for the data, keep definitions consistent, and flag the patterns that need action.
If nobody owns the numbers, they turn into dashboard wallpaper. If one person owns them and hiring leaders review them on schedule, you get faster decisions, tighter hiring control, and less wasted spend.
Conclusion
Tracking too many metrics slows action. A small set of funnel-based KPIs works better. Give each metric a clear owner. Define them the same way every time. Review them on a fixed cadence. That’s what separates reporting from improvement.
For scaling SMEs, the goal is simple: spot where candidates drop off, fix that stage, and keep speed, cost, and quality in balance. Once those signals are clear, hiring gets easier to manage and faster to improve.
If you need help turning those KPIs into a repeatable hiring process, Rent a Recruiter places experienced recruiters into your team within days. You get more structure, more visibility, and a hiring process you can actually steer.
FAQs
Which recruitment KPIs should we track first?
Start with the Big Four: cost per hire, time to fill, offer acceptance rate, and 90-day retention.
These four give you a clear baseline without burying your team in data from day one.
Cost per hire shows what hiring is costing the business. That matters to CEOs and CFOs because it ties recruitment activity directly to spend.
Time to fill shows where delays are slowing growth. If key roles stay open too long, teams miss targets, managers lose time, and revenue can take a hit.
Offer acceptance rate shows how strong your hiring process is in the market. If candidates keep saying no, you may have a problem with speed, pay, positioning, or the way your team sells the role.
90-day retention shows whether you’re hiring the right people, not just filling seats. If new hires leave early, the cost shows up fast in backfilling, lost time, and team disruption.
What’s the difference between time to hire and time to fill?
Time to fill tracks the number of days from job requisition approval to offer acceptance. It gives you a clear view of overall hiring efficiency and helps spot delays inside your own process.
If this number is high, the issue is not always candidate supply. It can point to slow approvals, unclear role briefs, too many interview stages, or poor interviewer availability. In other words, it shows where hiring is dragging and where time, and money, are being lost.
Time to hire tracks the number of days from a candidate entering your pipeline, usually from the point they apply, to offer acceptance. It shows how fast you move one person through the process.
That matters because slow movement often leads to lost candidates, lower offer acceptance, and more pressure on your team. If you want better hiring outcomes, you need to watch both metrics. One shows the speed of your full hiring process. The other shows how fast you convert interest into hires.
How often should we review recruitment KPIs?
Review recruitment KPIs on a set schedule so you can spot patterns early and adjust before hiring issues turn into missed targets.
A quarterly review gives you a solid baseline for bigger changes. Then use weekly or monthly tracking to keep hiring on course, protect team capacity, and make sure your recruitment process stays efficient.
This kind of rhythm matters. If you only check performance once in a while, small problems can turn into expensive ones. A drop in pipeline quality, slower time-to-hire, or higher cost-per-hire can creep up fast, especially in scaling teams.