Recruitment funnel metrics are the key to solving hiring inefficiencies. If roles are staying open too long or candidates are dropping out unexpectedly, these metrics pinpoint where things are going wrong – and how to fix them.
Here’s the bottom line: Companies using recruitment metrics achieve faster hires, lower costs, and higher offer acceptance rates. By tracking every step, from awareness to offer, you’ll gain visibility into bottlenecks and improve and rate your recruitment process.
Key takeaways:
- Only 1 in 180 applicants gets hired, and 97% of candidates never make human contact.
- Metrics like time-to-fill, offer acceptance rate, and application completion rate help identify issues and reduce delays.
- Companies with structured hiring processes see 24% faster time-to-hire and 19% lower costs.
If you’re scaling and struggling with recruitment inefficiencies, tracking these metrics is the first step to building a predictable, efficient hiring process. Let’s dive into how to measure and improve each stage of your recruitment funnel.
5 Key Recruitment Funnel Metrics to Boost Talent Acquisition
sbb-itb-a23bd6a
Mapping the Recruitment Funnel and Its Metrics
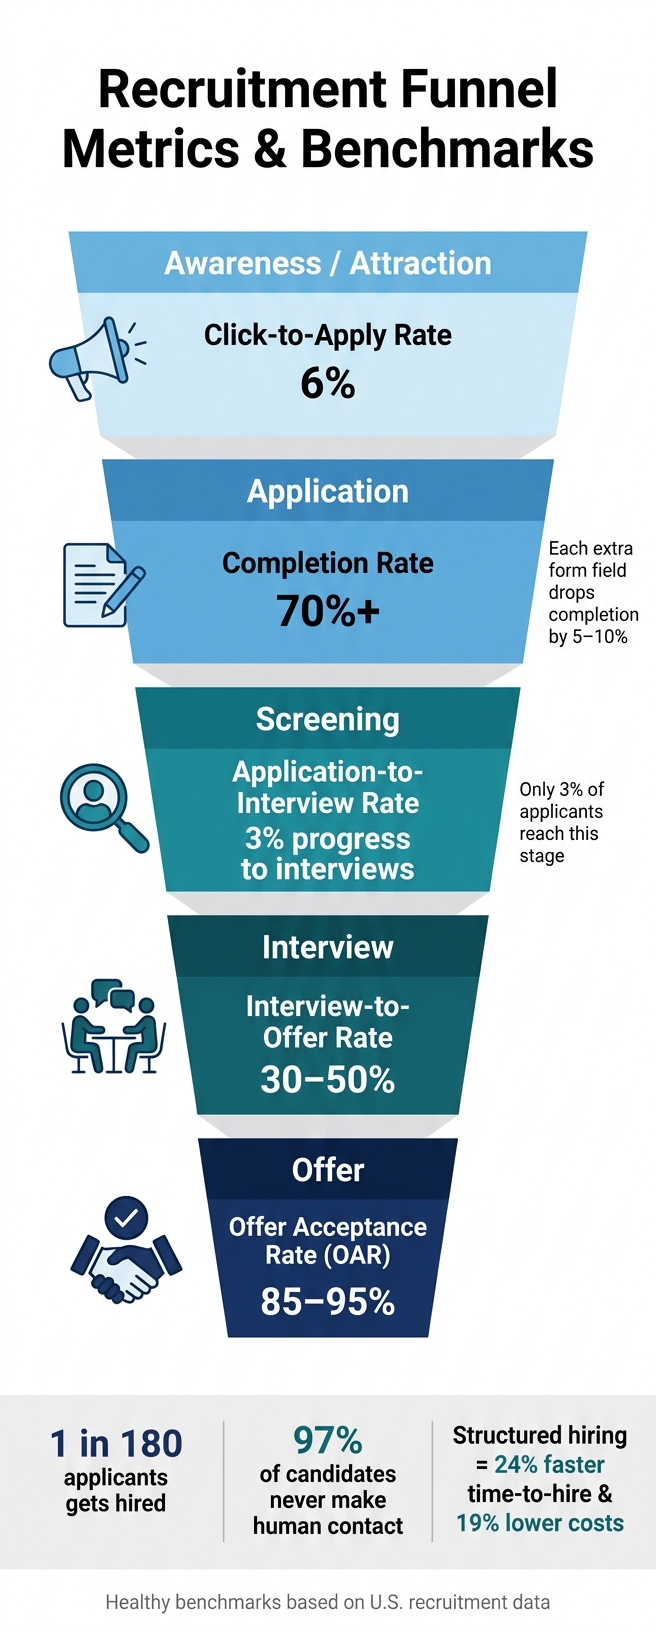
Recruitment Funnel Stages: Key Metrics & Benchmarks
Recruitment Funnel Stages and Conversion Points
Every stage of the recruitment funnel has its own set of metrics that reveal how efficiently candidates progress through the process. Understanding these numbers is key to improving your hiring pipeline. As candidates move from awareness to offer, some naturally drop out – and the drop-off rates at each stage highlight where you may need to focus.
The Awareness and Attraction stages are all about reach and relevance. Here, the click-to-apply rate is the critical metric, with a typical benchmark of just 6% [2].
At the Application stage, simplicity is crucial. Adding extra form fields can drop completion rates by 5–10% per field [2]. The Screening stage often creates the biggest bottleneck, with only 3% of applicants progressing to interviews [2]. Moving on to the Interview stage, you’ll see an interview-to-offer rate ranging from 30–50% [1]. Finally, the Offer stage wraps up the process, aiming for an Offer Acceptance Rate (OAR) of 85–95% [3][1].
| Funnel Stage | Key Metric | Healthy Benchmark |
|---|---|---|
| Awareness / Attraction | Click-to-Apply Rate | 6% [2] |
| Application | Completion Rate | 70%+ [1] |
| Screening | Application-to-Interview Rate | 3% [2] |
| Interview | Interview-to-Offer Rate | 30–50% [1] |
| Offer | Offer Acceptance Rate | 85–95% [3][1] |
Key Formulas for Calculating Funnel Metrics
Calculating recruitment metrics doesn’t need to be complicated. The most commonly used is the Stage Conversion Rate: divide the number of candidates moving forward by the number entering a stage, then multiply by 100. For instance, if 500 candidates are screened and 100 proceed to interviews, your screen-to-interview conversion rate is 20%.
Two broader metrics help assess overall funnel efficiency. Overall Yield measures how well your funnel converts applicants into offers. It’s calculated by dividing total offers by total applicants and multiplying by 100. The Selection Ratio goes a step further, showing total hires as a percentage of total applicants. For professional roles, this often falls between 1–5% [4]. With applications per hire having tripled since 2021 [2], keeping an eye on these figures is more critical than ever.
| Metric | Formula |
|---|---|
| Stage Conversion Rate | (Candidates Advancing ÷ Candidates Entering Stage) × 100 |
| Overall Yield | (Total Offers ÷ Total Applicants) × 100 |
| Selection Ratio | (Total Hires ÷ Total Applicants) × 100 |
| Cost Per Hire | (Internal Costs + External Costs) ÷ Total Hires |
| Time to Fill | Offer Acceptance Date − Requisition Open Date |
Another metric to monitor closely is Time in Stage – the number of days candidates spend at each step. If any stage exceeds 5 business days, it’s a warning sign of delays that could harm the candidate experience [1].
These formulas are just the start. For more industry insights, explore our recruitment blog. Standardizing how you calculate and define metrics ensures they accurately reflect your hiring performance.
Why Consistent Metric Definitions Matter
One of the biggest challenges recruitment teams face is inconsistency in how metrics are defined. For example, does "screened" mean a recruiter reviewed a résumé, or does it mean a phone screen was completed? If teams across departments or roles interpret metrics differently, the data becomes unreliable and impossible to act on.
"Recruitment metrics turn gut feelings into data." – Ryan, Taleva [3]
To make data actionable, every team needs to work from the same playbook. Start by defining a canonical funnel – for example, Applied → Screen → Hiring Manager Review → Interview → Offer → Accept – and apply it consistently [4]. This is especially important when comparing performance across roles. For instance, hiring a senior software engineer might require 191 applicants per hire, while hiring for another role might need only 47 [2]. Without consistent definitions, such comparisons can easily lead to flawed conclusions.
Core Recruitment Funnel Metrics Explained
Applicants Per Opening
This metric measures the volume of applicants generated per job posting. The formula is simple: Total Applicants ÷ Total Job Openings. On average, U.S. companies require 180 applicants to make one hire [2][6]. However, this figure varies significantly by industry. For instance, technology roles average 191 applicants per hire, while healthcare positions need only 47 [2].
To make sense of this metric, it’s essential to break it down by role type and sourcing channel. Proactive sourcing tends to deliver better-quality applicants, as shown by higher screening rates compared to general job board submissions [6][5]. If you’re seeing a healthy number of applicants but struggling to make hires, the problem might be your channel mix – relying too heavily on inbound applications and not enough on proactive outreach. Next, let’s look at how your application process affects candidate flow.
Application Completion Rate
The application completion rate is calculated as Completed Applications ÷ Started Applications. A strong rate is considered 70% or higher [1]. If yours is below that, it means candidates are starting the process but abandoning it midway – a red flag you can’t afford to ignore.
Common culprits include overly long forms, mandatory account creation, and poor mobile usability. Studies show that every additional field in an application can reduce completion rates by 5–10%, and overly complex forms contribute to a 60% abandonment rate [2][6]. As Pin insightfully states:
"If your apply process takes more than 5 minutes, you’re filtering for patience, not talent." – Pin [6]
Streamlining your application process can improve completion rates by 30–50% [6]. Keep applications under five minutes by eliminating fields that aren’t immediately necessary. Details like employment history, references, and cover letters can be gathered later. Optimizing this step keeps your recruitment funnel healthy and candidates engaged.
Offer Acceptance Rate
Once you’ve secured a strong applicant pool and simplified the application process, the Offer Acceptance Rate (OAR) becomes the final checkpoint. The formula is (Accepted Offers ÷ Total Offers Extended) × 100. In the U.S., the average OAR is 82%, with a healthy target of 85% or higher [1]. For technical roles, however, the range typically falls between 73–77% [2][6].
A low OAR often points to issues like uncompetitive compensation, delays in extending offers, or poor candidate experiences during interviews. For example, 42% of candidates drop out if scheduling takes too long [2][6]. Once a candidate disengages or accepts another offer, it’s tough to bring them back. Offers extended within 48 hours of the final interview are far more likely to be accepted than those delayed [1][5]. Together, these metrics help pinpoint where to focus your efforts to improve hiring outcomes.
| Metric | Formula | Healthy Benchmark | Red Flag |
|---|---|---|---|
| Applicants Per Opening | Total Applicants ÷ Total Openings | 180:1 average [2] | Varies by role type |
| Application Completion Rate | Completed ÷ Started Applications | 70%+ [1] | Below 60% [6] |
| Offer Acceptance Rate | (Accepted ÷ Extended Offers) × 100 | 85%+ [1] | Below 75% [1][5] |
How to Use Metrics to Fix Funnel Problems
Finding Bottlenecks and Drop-Off Points
To fix recruitment funnel issues, start by identifying where candidates are dropping out. Look at the percentage of candidates moving through each stage – from Application to Screen, Screen to Interview, and Interview to Offer – and compare these numbers to established benchmarks. If you’re falling short, it may be time to tweak your job descriptions or reconsider your sourcing strategy. For example, if many candidates drop off between Interview and Offer, your assessment process might be overly complicated or time-consuming.
Pay attention to how long candidates spend in each stage, as delays can lead to disengagement. Top candidates are typically available for just 10 days, yet the average hiring process takes around 23 days [10]. To prevent delays, set up automated alerts for any candidates stuck in a stage longer than your defined limits. This ensures your team can act quickly and avoid losing great talent.
Setting Benchmarks and Performance Targets
"A number without a comparison is a number without meaning." – Treegarden [7]
Once you’ve spotted bottlenecks, use benchmarks to turn your data into actionable goals. Metrics only make sense when compared to a baseline. Start by analyzing at least 90 days of internal pipeline data, though a full year is better to account for seasonal trends. Then, compare your numbers to external benchmarks to see where you stand.
Here’s a quick guide to healthy conversion rates for each stage of the funnel, along with common fixes:
| Funnel Stage Transition | Healthy Benchmark Range | Common Fix |
|---|---|---|
| Application → Screen | 20–40% [9] | Simplify job descriptions; add qualifying questions |
| Screen → Interview | 50–70% [9] | Align recruiters and hiring managers on criteria |
| Interview → Offer | 20–40% [9] | Use structured scorecards; reduce interview rounds |
| Offer → Acceptance | 85–95% [9] | Be transparent about compensation; speed up offers |
Keep in mind that benchmarks can vary depending on the role. Engineering, sales, and operations positions often show different patterns in the funnel. This is especially true for technical roles, which often require specialized IT recruitment support to maintain healthy conversion rates. Adjust your targets based on the role type, seniority, and location to get a clearer picture of your performance.
Improving Processes Based on Metric Data
Once you’ve identified where candidates drop off, the next step is to fix those specific issues. If your application-to-screen rate is low, check your job descriptions. Are they clear and focused on the role, or are they weighed down by unnecessary requirements? If your interview-to-offer rate needs improvement, there may be a misalignment on what makes a candidate qualified. Introducing structured scorecards can help standardize evaluations and eliminate confusion.
Speed also plays a critical role in offer acceptance. Aim to extend offers within 48 hours, and have hiring managers personally call candidates before sending formal offers. Addressing compensation expectations early in the process can also reduce the risk of last-minute surprises. Focus on the stages with the largest gaps rather than trying to overhaul the entire process at once.
Building a Scalable Talent Acquisition Framework
Setting Up a Data Capture and Reporting System
Fixing funnel challenges starts with a system that identifies issues before they derail your hiring process.
Begin by configuring an applicant tracking system (ATS) for stage-level tracking and timestamps. While spreadsheets might work for a few roles, they quickly become unmanageable once you exceed 20 open positions [8]. At this point, automated data capture through ATS timestamps becomes non-negotiable.
Ensure your stage definitions are clear and consistent to protect the integrity of your data [8][12]. Overlooking this crucial step can lead to corrupted data, making reports unreliable and hindering decision-making.
"If a dashboard shows everything to everyone, it shows nothing useful to anyone." – Calvin Botez, Treegarden [7]
Once your data is clean, create three tailored dashboard views to cater to different audiences:
| Dashboard View | Primary Audience | Key Metrics | Cadence |
|---|---|---|---|
| Operational | Recruiters | Candidate aging, pipeline snapshot, task queue | Daily/Weekly |
| Strategic | HR Directors | Funnel conversion rates, cost-per-hire, source effectiveness | Monthly/Quarterly |
| Executive | C-Suite | Headcount plan attainment, recruitment cost as % of payroll | Quarterly/Annual |
Set up stage-aging alerts to notify your team when candidates linger in a stage beyond your service-level agreement (SLA). This automation eliminates the need for manual reminders and ensures a smoother process.
With accurate, automated data in place, the next step is aligning these metrics with the expectations of your hiring stakeholders.
Using Metrics to Align Hiring Stakeholders
Reliable data is a game-changer when it comes to aligning stakeholders. It empowers recruiters and shifts conversations with hiring managers and leadership from assumptions to facts.
Start intake meetings by presenting funnel data. For example, showing a hiring manager that the last three roles at their seniority level took 44 days to fill sets a realistic foundation for discussions. This approach replaces vague urgings to "move faster" with a data-backed perspective grounded in market realities [13].
For leadership, focus on the metrics that matter most: cost-per-hire, headcount plan attainment, and time-to-fill trends. A growing number of CFOs – 68%, to be exact – now require this data before approving additional headcount [8]. Without this information readily available, your team risks losing credibility and influence in budget discussions.
Set clear hiring manager SLAs, such as providing interview feedback within 24 hours of a debrief. Teams that implement and track these agreements consistently reduce bottlenecks in the hiring funnel. Pairing SLAs with automated weekly pipeline updates allows hiring managers to monitor candidate progress without needing to ask [8].
"If your recruiting narrative is built on activity (‘we screened 300 resumes’), you’re stuck defending effort instead of outcomes." – Tenzo.ai [12]
When talent acquisition teams can confidently present predictable time-to-fill and cost-per-hire data, they elevate recruitment from a reactive task to a strategic business function.
How Rent a Recruiter Supports Scalable Hiring
Once you’ve streamlined data capture and aligned stakeholders, Rent a Recruiter can take your scalable hiring to the next level. By embedding experienced recruiters directly into your team – often within days – we bring the structure, visibility, and consistency needed for effective hiring at scale.
Our embedded recruiters ensure proper ATS setup, clear stage definitions, and reporting cadences are in place from day one, so your funnel data is accurate right from the start.
For high-growth companies in sectors like technology, SaaS, fintech, and engineering, this matters because the cost of inefficiencies adds up fast. Clients who work with Rent a Recruiter typically cut hiring costs by up to 70% compared to traditional commission-based agencies. At the same time, they save over 80 hours per month by reducing administrative burdens. That’s time and money you can reinvest into growth instead of managing a fragmented process.
Whether you need short-term support to meet immediate hiring goals or a long-term partner to build a predictable recruitment function, the embedded model delivers full-cycle hiring expertise without the expense of creating an in-house team from scratch.
Conclusion and Next Steps
Key Takeaways on Recruitment Funnel Metrics
Recruitment funnel metrics are your diagnostic tool for identifying where candidates drop off, helping you address specific issues instead of relying on guesswork.
Here’s how to approach refining your recruitment process:
- Focus on essential recruitment metrics: Time-to-Fill, Cost-per-Hire, Quality of Hire, Source of Hire, and Offer Acceptance Rate provide a clear picture of your funnel’s performance.
- Take precise actions: Streamlining applications, speeding up scheduling, and setting clear SLAs with hiring managers can significantly improve hiring speed and cost-efficiency. Breaking metrics down by department, role, and source helps you spot hidden bottlenecks that averages might obscure.
Companies that treat their recruitment funnel as an integrated system consistently achieve better results. With accurate metrics, you can make sharper decisions – especially critical for scaling businesses. This kind of clarity leads to actionable improvements in your hiring process.
"The best recruitment teams in 2026 won’t be the ones with the biggest budgets… they’ll be the ones with the best funnels." – Eminence Industry [11]
Book a Consultation with Rent a Recruiter
If your recruitment funnel isn’t delivering the results you need, this guide is your starting point. Knowing what to measure is essential, but acting on that data is what transforms outcomes.
Rent a Recruiter places experienced recruiters directly within your team in just days. They’ll help you build the structure and reporting needed for scalable, efficient hiring.
Ready to transform your hiring process? Book a consultation today and see how Rent a Recruiter can turn your data into smarter, faster hiring.
FAQs
Which recruitment funnel metrics should I track first?
To fine-tune your talent pipeline, focus on tracking the right metrics. Start with time-to-hire to gauge how quickly you’re filling roles, offer acceptance rate to see how competitive your offers are, and application rate to measure the effectiveness of your sourcing efforts. Keep an eye on the screen-to-interview ratio to ensure the best candidates are moving forward, and monitor candidate drop-off rates to pinpoint where you’re losing talent.
Need help? Rent a Recruiter brings structure and clarity to your hiring process, making it scalable and reliable as your business grows.
How do I set consistent stage definitions in my ATS?
To create consistent stage definitions in your ATS, start by aligning your hiring process with a practical, step-by-step structure based on real actions rather than hypothetical stages. Clearly document each milestone, ensuring all stakeholders are on the same page. Use overarching pipeline categories to maintain uniformity across different teams. Aim to keep your funnel between 5 and 8 stages, combining steps that happen within a 24-hour window. This approach streamlines workflows and enhances the accuracy of your reporting.
What should I do when candidates get stuck in one stage?
When candidates get stuck in a stage, pinpoint the hold-up by tracking how long they spend there. These delays often highlight inefficiencies, such as slow feedback from the team, scheduling conflicts, or vague evaluation criteria.
Address these issues with structured scorecards, clear SLAs (service-level agreements) for hiring managers, and automated scheduling tools to streamline the process. If the problem stems from mismatched expectations, take a step back and refine your screening criteria. Prioritizing speed and clear communication is critical to keeping top talent engaged and moving forward.