If hiring feels slow, expensive, or hard to control, the problem is usually visible in the numbers long before it shows up in headcount plans.
I’d keep this simple. A good recruitment audit tracks 10 metrics that show where hiring is dragging, where spend is leaking, and whether new hires are working out. For scaling teams in SaaS, Technology, IT, Fintech, Engineering, Security, Insurance, and Professional Services, that means looking at speed, cost, funnel flow, source mix, offer close rate, hire quality, retention, and process experience in one view.
In short, I’d use this article to answer three business questions:
- Where are we losing time?
- Where are we overspending?
- Which parts of hiring are hurting outcomes later?
The metrics covered are:
- Time to Fill
- Time to Hire
- Cost per Hire
- Recruiter Productivity
- Funnel Conversion Rate
- Source of Hire
- Offer Acceptance Rate
- Quality of Hire
- First-Year Attrition
- Candidate Experience Score
A few benchmark numbers help set context. U.S. averages often land around 42 days to fill a role, about $4,700 per hire, and roughly 80% to 90% offer acceptance depending on role type and market conditions. But the point is not to chase a market average. It is to see where your own process is slowing growth, adding cost, or leading to weak hiring results.
Read the metrics together, not one by one. If time to hire drops but first-year attrition climbs, you may be moving too fast. If cost per hire rises while source of hire shows heavy agency use, you may have a channel mix problem. If offer acceptance falls, the issue may sit in pay, process delay, or late-stage alignment.
That is where the commercial value sits. When you audit hiring properly, you can cut wasted spend, save internal time, and make hiring output easier to plan.
The rest of the article breaks down each metric and shows what it tells you about hiring performance.
Recruitment KPIs Every HR Professional Must Know | Time to Hire, Cost per Hire & More
sbb-itb-a23bd6a
What a Good Recruitment Audit Should Measure
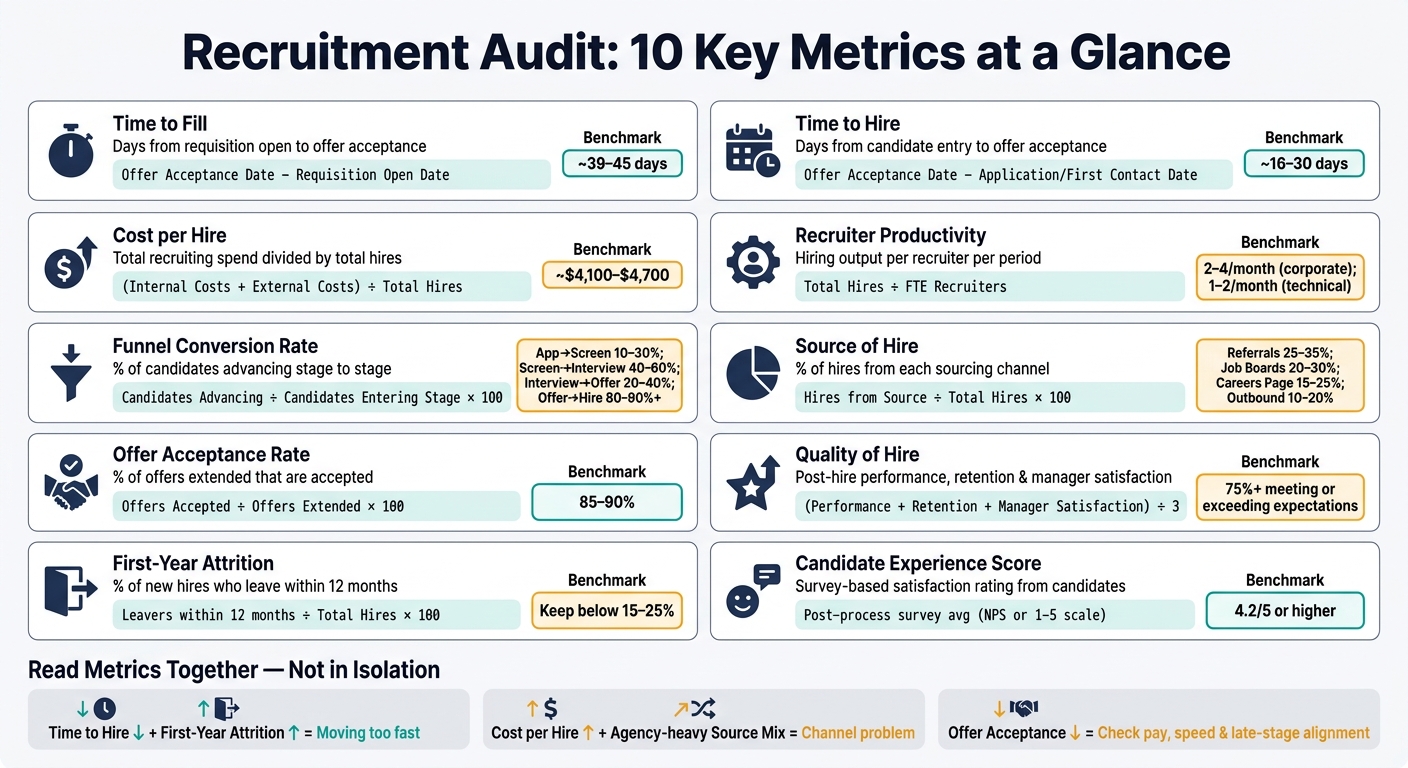
Recruitment Audit: 10 Key Metrics, Benchmarks & Formulas
A useful recruitment audit should track seven core areas: speed, cost, funnel efficiency, source performance, hiring quality, retention, and candidate experience.
Why these seven? Because they show where hiring is slowing down, where money is leaking, and where outcomes are falling short. If you only look at one metric, like time to fill, you miss the bigger picture.
Use a 6 to 12 month lookback window. That gives you a steadier view and helps smooth out seasonal changes and one-off spikes.
Then break the data down by department, role type, recruiter, and hiring manager. That’s how you spot bottlenecks or rate your recruitment process to identify specific gaps. A headline number might tell you there’s a problem. This level of detail shows you where it sits and who owns it.
Benchmarks help, but they should be a reference point, not the goal. For example, SHRM puts average cost per hire at about $4,700 [1]. That’s useful as a baseline, but your hiring targets should match your own role mix, growth stage, and past performance.
Use external benchmarks to set context. Then compare results by role, team, and recruiter to see what good looks like inside your business.
| Audit Dimension | Key Metric | Realistic U.S. Benchmark |
|---|---|---|
| Speed | Time to Fill | About 42 days [1] |
| Speed | Time to Hire | About 24 days [1] |
| Cost | Cost per Hire | About $4,700 [1] |
| Funnel Efficiency | Funnel Conversion Rate | 3:1 [1] |
| Source Performance | Source of Hire | Compare channels by quality, speed, and retention |
| Hiring Quality | Quality of Hire | Composite score from performance reviews, ramp-up speed, retention, and manager ratings |
| Retention | First-Year Attrition | >85% retention [1] |
| Candidate Experience | Candidate Experience Score | >80% [1] |
1. Time to Fill
Time to fill tracks the number of calendar days between a requisition opening and an offer being accepted. In plain terms, it shows how long a role stays open before someone says yes.
Time to Fill = Offer Acceptance Date − Requisition Open Date
This is not the same as time to hire. Time to fill starts when the requisition opens. Time to hire starts when a candidate applies or when your team first contacts them. That gap matters.
Why? Because time to fill shows delays inside your own process, like slow approvals or roles that sit unposted. Time to hire can miss that. So yes, benchmarks help, but only if you compare like with like by role type.
In the U.S., many teams aim for:
- 30 to 40 days for standard professional roles
- 45 to 60 days for technical roles
- 60+ days for engineering and senior leadership roles
For nonexecutive roles, a median of 39 days is a useful reference point.[1]
If your time to fill is high, there’s usually a bottleneck somewhere in the process. Common issues include slow requisition sign-off, weak sourcing, too many interview stages, or offers that don’t match the market. And every extra day has a cost, lost output, more pressure on your team, and slower growth.
The best way to spot the problem is to measure time spent at each stage:
- Approval
- Posting
- Sourcing
- Screening
- Interviews
- Offer
- Acceptance
Once you can see where the delay sits, compare time to fill with time to hire. That helps you separate process delay from candidate delay.
If you want to bring this number down, start with the obvious friction points. Simplify approvals. Cut interview rounds that add little value. Pre-block hiring manager time. Build talent pipelines for repeat hires with an embedded recruitment service. Small fixes here can save weeks, and that means lower hiring drag, less internal admin, and better hiring outcomes.
2. Time to Hire
Time to hire tracks the number of calendar days between the moment a candidate enters your pipeline and the day they accept your offer. Unlike time to fill, this starts at the candidate level, not the requisition level.
Time to Hire = Offer Acceptance Date − Candidate Application Date (or First Contact Date)
This metric shows how fast your team moves candidates through the hiring process once they are in it. Put simply, it tells you whether your process keeps momentum or lets good people sit waiting.
In the U.S., benchmarks vary by role, but a 35-day median is a useful reference point. Senior searches often take much longer.[4]
In an audit, a high time to hire usually points to friction inside the process. That often means:
- Slow interviewer feedback
- Too many interview rounds
- Scheduling delays
- A long offer or approval process
To see what’s slowing things down, break the metric into stage timings: application to screen, screen to interview, interview to decision, decision to offer, and offer to acceptance. That view shows exactly where candidates are waiting, and where your team is losing time.
The fastest fixes are usually straightforward. Set 24 to 48 hour feedback SLAs for interviewers. Standardise interview stages with structured scorecards. Use self-scheduling tools to cut back-and-forth and reduce admin time.
Once speed is clear, cost per hire shows whether that speed is affordable.
3. Cost per Hire
Cost per hire is the average amount you spend to fill one role over a set period. It pulls together both internal and external recruiting costs, so you can see your total hiring spend in one number.
The standard SHRM/ANSI formula is:
Cost per Hire = (Total Internal Recruiting Costs + Total External Recruiting Costs) ÷ Total Number of Hires [7]
Internal costs include recruiter and hiring manager time, salaries, ATS or CRM tools, referral bonuses, and internal advertising. External costs include job board fees, agency fees, background checks, assessments, and advertising. Use the same time period for both costs and hires. That keeps the number consistent and makes it easier to compare month to month or quarter to quarter.
Where this metric becomes useful is in the way you break it down. Benchmarks change by role, and a blended average can blur what is actually happening. One top-line figure might look fine while one team is overspending badly. That is why you should split cost per hire by role type, department, and sourcing channel.
In an audit, a high cost per hire often points to a few common issues:
- Heavy agency use
- Weak sourcing channels
- Too many interview rounds
- Slow approvals
- Too many unqualified applicants
A lower cost per hire is not always a good sign. If costs drop because screening is weak or hiring teams cut corners, you may pay for it later in poor hiring outcomes. Read this metric alongside quality of hire and time to fill.
Once cost is under control, the next step is to see whether recruiters are delivering enough hires. From there, measure recruiter productivity to check whether hiring output matches recruiter effort.
4. Recruiter Productivity
After cost per hire, look at whether each recruiter is turning capacity into actual hires.
Recruiter productivity shows how much hiring output each recruiter delivers over a set period, usually a month or quarter. The core formula is:
Recruiter Productivity = Total hires in period ÷ Number of FTE recruiters [1]
If you have part-time recruiters, count them as FTE fractions, not as whole heads.
Benchmarks change by role type. For corporate roles, a common range is 2 to 4 hires per recruiter per month. For technical roles, it is often 1 to 2. High-volume hiring can sit at 5 to 10+, while executive or niche searches may land closer to 0.3 to 0.7. [1]
In an audit, this works best as a diagnostic metric, not a league table.
If productivity is low, the issue is often not recruiter effort. More often, it points to one of these problems:
- Workloads are too high
- Workflow is inconsistent
- Hiring managers are slow to make decisions
If two recruiters are working on similar roles but producing very different results, that can point to uneven process, patchy tooling, or delays from hiring managers. If output is low across the team, start with workload. For corporate roles, 15 to 20 active requisitions per recruiter is often a workable range. Push beyond that, and you can start to see weaker candidate experience, longer time to fill, and lower retention. [1]
The commercial point is simple: don’t jump straight to adding headcount.
Fix the process first. You can improve output with intake meetings, ATS automation, and 48-hour hiring manager feedback SLAs.
Use this metric alongside funnel conversion data so you can tell the difference between weak sourcing and a hiring process that is getting stuck.
5. Funnel Conversion Rate
After recruiter productivity, funnel conversion shows you where candidate flow breaks down. Funnel conversion rate tracks the share of candidates who move from one hiring stage to the next. In plain terms, it shows where people move forward and where they fall away, so you can diagnose the hiring process stage by stage.
The formula at each stage is simple:
Funnel Conversion Rate (%) = Candidates advancing to next stage ÷ Candidates entering current stage × 100[11][12]
For example, if 200 candidates apply, 80 pass the recruiter screen, and 40 reach the hiring manager interview, the conversion rates are 40% from application to screen and 50% from screen to interview.
U.S. benchmarks change by industry, seniority, and market conditions. Use these ranges to spot outliers, not to force every role into the same target.[10]
| Funnel Stage | Typical U.S. Benchmark |
|---|---|
| Application → Recruiter screen | 10 to 30% |
| Recruiter screen → Hiring manager/technical interview | 40 to 60% |
| Interview → Offer | 20 to 40% |
| Offer → Hire | 80 to 90%+ |
Outlier rates at any stage are where you should look first. That’s where the process is telling you something.
- Low application-to-screen rates usually point to weak sourcing or poor targeting.
- Low screen-to-interview rates often mean screening is out of sync with what hiring managers want.
- Low interview-to-offer rates can signal too many interview rounds, unclear criteria, or inconsistent scoring.
- Low offer-to-hire rates often come down to pay, benefits, or slow decision-making.
The fix is rarely “do more hiring”. It’s fix the stage that’s leaking candidates.
Early-stage conversion tends to improve when job descriptions are tighter, must-have and nice-to-have criteria are clearly separated, sourcing channels are better targeted, and screening scorecards are written down and used the same way every time. Mid- and late-stage conversion tends to improve when you cut extra interview rounds, set firm feedback SLAs, and check that compensation ranges match current U.S. market rates. Speed matters as well, because finalists are more likely to accept another offer if your process drags.[10]
Hourly roles often convert better at the top of the funnel. Specialized tech roles often convert better later in the process.
Next, source of hire shows which channels produce the strongest candidates.
6. Source of Hire
Source of Hire (SoH) shows where your hires come from, channel by channel: job boards, referrals, your careers page, outbound sourcing, agencies, or internal mobility. The formula is simple:
Source of Hire (%) = Hires from a specific source ÷ Total hires × 100
Measure it across your audit window and give each hire one primary source, ideally the first touchpoint, not the last. That gives you a clearer view of what’s actually driving hires.
U.S. benchmarks vary by sector and company size, but these ranges are a solid starting point if you want to spot gaps in your mix[5][13][14][15][16]:
| Channel | Typical U.S. Benchmark |
|---|---|
| Job boards (Indeed, LinkedIn Jobs, etc.) | 20-30% of hires |
| Employee referrals | 25-35% of hires |
| Company careers page | 15-25% of hires |
| Direct outbound sourcing (LinkedIn outreach, talent pools) | 10-20% of hires |
| Agencies | Single digits to low teens |
High-growth companies often aim for referrals and outbound sourcing to each make up 30%+ of total hires, while keeping inbound sources below about 35%[9][16]. If your audit shows a heavy tilt toward job boards and very little from referrals, that usually points to a sourcing mix that needs work.
This is where SoH becomes more than a reporting metric. It helps you see which channels produce hires that are faster, lower cost, and more likely to stay.
Referrals, for example, can convert at about 4x the rate of job board applicants and often lead to faster hiring with stronger retention[19]. Outbound sourced candidates are also 5-6x more likely to be hired than inbound applicants[17][18]. In-house talent and agencies both play a role, especially for hard-to-fill roles, but they usually come with a higher cost per hire.
SoH should guide hiring decisions, not just sit in a dashboard. Review it alongside cost per hire, time to fill, quality of hire, and first-year attrition by source. That’s how you move from “where did this hire come from?” to “which channels are giving us the best hiring outcome for the money?”
To improve SoH, tighten your channel mix and build more sourcing strength in-house.
- Strengthen your employee referral programme with clear incentives, simple submission, and steady communication.
- Build internal outbound sourcing through recruiter training on LinkedIn outreach and talent community management.
- Cut back on broad job board usage and focus on fewer sources with stronger conversion.
- If agencies make up too much of your hiring mix, build more internal sourcing capacity and shift spend toward channels you control.
Once your source mix is clear, the next step is whether candidates accept the offer.
7. Offer Acceptance Rate
After source of hire, the next thing to check is simple: do the right candidates say yes? That’s what Offer Acceptance Rate (OAR) tells you.
It measures the share of formal offers that get accepted.
Offer Acceptance Rate (%) = Number of Offers Accepted ÷ Total Offers Extended × 100
So if you extend 40 offers and 30 are accepted, your OAR is 75%.
When you calculate it, leave out rescinded offers and any offers still pending at the end of the reporting period. If you keep them in, the number gets distorted.
A healthy OAR usually sits between 80% and 90%. If you’re below 75%, that often points to a hiring process problem. This metric shows whether your sourcing and interview process turns into accepted hires. Put bluntly, it tells you whether your team can close.
In a recruitment audit, low OAR rarely comes down to compensation alone. Sometimes the issue is slow offer turnaround. Sometimes candidates accept another offer before yours gets approved. In other cases, the problem shows up late, role scope, working hours, location expectations, or work setup weren’t fully clear earlier in the process.
This is why it helps to break OAR down by:
- role family
- seniority
- location
- hiring manager
That split helps you see whether the issue sits across the business or with one team, one market, or one part of the process.
The levers that move OAR most are speed, alignment, and how you present the full offer.
Aim to get offers out within 24 to 48 hours of the final interview where possible.[20][21][22] That window matters. If approvals drag, you lose momentum, and top candidates don’t sit around waiting.
You’ll also get better results if compensation and timing are discussed early, not at the end. That gives you a chance to test expectations before the formal offer lands.
And don’t position the offer around base salary alone. Show the full package:
- salary
- bonus
- equity
- benefits
- PTO
- flexibility
That matters more than many hiring teams think. A candidate isn’t judging one line item. They’re weighing the whole deal, along with how your process felt.
Track decline reasons closely so the right owner can fix the root cause. If the pattern is pay, address pay. If it’s timing, tighten approvals. If it’s process, fix the handoffs and late-stage confusion.
8. Quality of Hire
Once a candidate accepts your offer, the next test is simple: do they succeed in the role?
That’s what Quality of Hire (QoH) measures. It tells you whether your hiring decisions lead to strong, lasting hires, not just filled seats. Speed and cost mean very little if the person underperforms or leaves early.
QoH is usually a combined score made up of performance, retention, and manager satisfaction, then scaled to a 0 to 100 score.
As a practical benchmark, anything above 80 is strong. Anything below 60 points to a repeat hiring-quality issue. If you do not yet have the full score, use first-year retention and manager satisfaction as supporting signals.
When QoH is weak, your process is likely choosing people who do not perform, do not stay, or do not meet manager expectations. That makes QoH the bridge between sourcing quality and long-term hiring results. It also gives you a clear way to compare channels. Which sources bring in hires who still look like a good decision six or 12 months later? That’s the source mix you want more of.
To improve QoH, focus on a few basics:
- Structured interviews
- Clear success criteria from intake
- A 30, 90, and 180-day onboarding plan
Used alongside your other audit metrics, QoH helps you spot where the hiring process is breaking down, and where to fix it first.
Tracked over time, QoH turns recruitment audit data into hiring decisions you can tighten, measure, and improve.
9. First-Year Attrition
Quality of hire tells you if someone can do the job. First-year attrition tells you if they stay. It tracks the share of new hires who leave within 12 months, for any reason.
First-Year Attrition (%) = (Number of employees who left within 12 months of hire ÷ Total number of employees hired who were eligible to reach 12 months) × 100 [25][29][31]
A first-year attrition rate of 15% to 25% is common. If you’re above that, it’s time to dig in. [24][25][30][32]
The headline number on its own won’t tell you much. The useful part is the breakdown. Look at it by department, team, hiring manager, source of hire, and tenure bucket. That’s where patterns start to show. [24][26][27]
If exits bunch up in the first 90 days, that’s often a sign that expectations were off or onboarding fell short. [24][26][27] In plain terms, people joined one job and found another.
This metric has a direct cost impact. Even a small drop in early exits can cut replacement spend and reduce ramp-up loss. [25][23][26][30]
The main ways to improve it are simple:
- realistic job previews during recruitment
- better selection
- structured 30/60/90-day onboarding plans
- early manager check-ins [27][26][28][24]
When early exits start to climb, review selection and onboarding first. If people are leaving inside 90 days, check how well your hiring process set the job, team, and role expectations from the start. Rising early exits often point to gaps in the candidate journey. Partnering with embedded recruiters can help audit these gaps and stabilize your hiring structure.
10. Candidate Experience Score
After retention, look at how the hiring process feels from the candidate side.
Candidate experience score measures how people rate your process from application through decision. It helps explain why a funnel can look healthy on paper but still break down at offer stage or miss out on referrals. It covers communication, transparency, interview fairness, and overall satisfaction.
First, decide who you’re surveying. Some teams ask every applicant. Others focus on later-stage candidates, where feedback is often more useful.
A common method is candidate Net Promoter Score, or cNPS. You ask candidates how likely they are to recommend your hiring process on a 0 to 10 scale. Scores are then grouped into Promoters, Passives, and Detractors:
- Promoters: 9 to 10
- Passives: 7 to 8
- Detractors: 0 to 6
cNPS = % of Promoters (9–10) − % of Detractors (0–6)
Teams can also track an average satisfaction score on a 1 to 5 or 1 to 10 survey scale. A solid benchmark is 4.0 to 4.5 on a 1 to 5 scale, or 8.0 to 9.0 on a 1 to 10 scale. But your own trend matters more than any outside benchmark. If scores drop by role, recruiter, or hiring stage, that’s where you should look first. Only 26% of North American job seekers report a great candidate experience[33][34].
In a recruitment audit, this metric shows where the process feels slow, unclear, or uneven in ways pipeline data won’t show you. Low scores often point to communication gaps, delays, or interviews that vary too much from one panel to the next.
And this is not just a brand issue. It’s a hiring performance issue. Companies with poor candidate experience can see up to 40% higher offer rejection rates[35].
The fixes are usually straightforward:
- Reply faster
- Make scheduling easier
- Cut extra interview steps
- Prepare interviewers better
- Set clear expectations early
- Use automation or candidate portals for status updates
That matters because silence damages trust fast. In U.S. research, 36% of candidates said they did not hear back from employers one to two months after applying[36]. Even a short update can change how your process is judged.
Standardized interview questions and hiring manager training also help. When candidates feel informed and treated with respect, they are more likely to score the process well, even if they don’t get the job.
Used alongside the metrics above, this score helps you spot where process friction is costing you time, offers, and hiring results.
How to Turn These Metrics Into Action
Treat these metrics as one system, not a set of separate numbers.
When you read them together, you can see where your hiring process runs well and where it starts to leak time, money, or quality. That matters because one shift rarely tells the full story on its own.
If Time to Hire drops but First-Year Attrition climbs, you’re likely moving too fast and making weaker decisions. If Funnel Conversion still looks strong but Offer Acceptance Rate falls, the issue usually sits elsewhere, often in compensation, communication, or the time it takes to move from final interview to offer. The point isn’t to report numbers. It’s to find the bottleneck.
One of the clearest gains from a recruitment audit is finding overspend by source. Break Cost per Hire down by channel, such as job boards, referrals, direct sourcing, and agencies, then compare that spend against hiring quality and retention by source. If one channel keeps costing more but doesn’t lead to better hires or longer retention, move that budget. That’s where hiring teams often save time and money without hurting output.
Once you can see the cost pattern, keep a close eye on the metrics that show whether hiring quality is starting to slip.
For early warning signs, focus most on Offer Acceptance Rate and First-Year Attrition. A steady drop in offer acceptance, or a rise in first-year attrition, especially in the first 90 to 180 days, should trigger a review. These are not just reporting notes. They are signs that you may need to check:
- Compensation
- Decision speed
- How clearly the hiring process sets role expectations from the start
Use the quick reference table below to turn those signals into a review checklist.
For more insights on optimizing your hiring strategy, explore our recruitment blog.
Recruitment Audit Metrics: Quick Reference Table
After reviewing each metric in detail, use this table to compare them fast during the audit.
This is where the numbers start to pay off. A good audit table helps you spot cost leaks, time drag, and hiring weak points and challenges at a glance. For CEOs, CFOs, HR leaders, and Talent Leaders, that means better decisions without digging through pages of notes.
| Metric | Definition | Formula | U.S. Benchmark / Target Range | Main Action It Informs |
|---|---|---|---|---|
| Time to Fill | Calendar days from requisition open to offer acceptance | Average days from requisition open to offer acceptance | About 39 to 45 days; SHRM’s 2026 median for nonexecutive roles is 39 days [2][9] | Spot approval delays, scheduling gaps, and workflow bottlenecks |
| Time to Hire | Days from candidate entry to offer acceptance | Average days from candidate entry to offer acceptance | About 16 to 30 days depending on role [5][9] | Identify slow screening, interview, or decision stages |
| Cost per Hire | Total recruiting spend divided by hires made | (Internal costs + external costs) ÷ total hires | About $4,100 to $4,129 [8][38][39] | Control sourcing budget, reduce agency reliance, and improve ROI |
| Recruiter Productivity | Hiring output per recruiter over a set period | Hires per recruiter per month or quarter | Use as a capacity trend, not a stand-alone target [2] | Assess capacity and spot overload |
| Funnel Conversion Rate | Percentage of candidates advancing from one stage to the next | Candidates advancing ÷ candidates entering stage × 100 | No single universal benchmark; compare stage-to-stage trends over time [6][37] | Pinpoint where candidates drop off and fix screening or interview calibration |
| Source of Hire | Where hired candidates originated | Count of hires by channel ÷ total hires × 100 | Compare channels by quality, speed, and retention | Reallocate sourcing budget to the channels that produce the best hiring outcomes |
| Offer Acceptance Rate | Percentage of extended offers that candidates accept | Offers accepted ÷ offers extended × 100 | 85% to 90% for well-aligned teams [6] | Improve compensation alignment, close speed, and candidate engagement |
| Quality of Hire | Post-hire performance, retention, and manager satisfaction | (Performance score + retention score + manager satisfaction score) ÷ 3 | 75%+ rated meeting or exceeding expectations [9] | Refine hiring standards, assessment design, and selection criteria |
| First-Year Attrition | Percentage of new hires who leave within 12 months | Employees leaving within 12 months ÷ total hires × 100 | Lower is better; compare internally by role type [3][37] | Review onboarding, role fit, and selection accuracy |
| Candidate Experience Score | Survey-based satisfaction rating from candidates who went through the process | Post-process survey average (NPS-style or 1 to 5 scale) | 4.2/5 or better [6] | Reduce process friction, improve communication, and strengthen employer brand |
A table like this works best when you use the metrics together, not in isolation. For example, if time to fill is high but time to hire is low, the issue may sit upstream in approvals or requisition handling, not with recruiters. If cost per hire is climbing while source of hire shows heavy agency use, you may have a sourcing mix problem rather than a recruiter performance problem.
That’s the point of the audit. You’re not just tracking recruitment activity. You’re finding where hiring slows down, where money slips out, and what to fix first.
Conclusion
A recruitment audit is only as useful as the metrics you track.
The strongest audits focus on the small set of numbers that show speed, cost, quality, and candidate drop-off. What matters is not how many metrics you collect. It is the pattern those metrics show.
Read these numbers together. That is how you spot whether the issue is coming from delays, overspend, or poor hiring outcomes. Once you know that, you can decide where to step in first.
The aim is simple: find the bottleneck and fix it.
Set one hiring priority, one owner, and one follow-up date. For growing companies, that shift makes hiring far more predictable and far easier to manage.
If your team does not have the bandwidth to track these metrics and act on them with consistency, Rent a Recruiter can place experienced recruiters into your team and manage reporting from end to end.
FAQs
How often should we run a recruitment audit?
The right frequency comes down to how much hiring you’re doing.
If you hire fewer than 10 people a year, a 30-minute quarterly review is usually enough. If your hiring volume is higher, a monthly review gives you a better read on metrics like cost per hire and time to fill before they start affecting the business.
Whatever your hiring volume, hiring managers should review the pipeline every week. That helps you spot bottlenecks, source issues, and delays early, before they turn into missed targets or extra cost.
If your metrics start slipping, audit the process straight away.
Which metrics should we fix first?
Start with the Big Four: cost per hire, time to fill, offer acceptance rate, and 90-day retention. These give you a baseline for hiring efficiency and quality.
Then track time-in-stage to spot bottlenecks. If one stage takes more than 5 business days, investigate it first. Look closely at internal admin time and whether delays come from recruiter capacity or hiring manager feedback.
What data do we need to track these metrics?
Track clean, accurate data for every hire. That means key dates such as job posting, application, interview, offer, and acceptance. You should also log hiring spend, including internal costs and external expenses.
If you want clear funnel and efficiency reporting, record the candidate source, total applicants, status changes, and a clear audit trail for each requisition. An ATS can do this well, but a simple spreadsheet can also work, if your team uses the same criteria every time.
The business case is simple: better data gives you better hiring decisions. You can spot delays, see which channels are worth the spend, and get a clearer view of cost per hire and time to hire.