If your hiring data shows up at month-end, you are already late.
I’d sum this up simply: live recruitment data helps you cut delays, control spend, and keep headcount plans on track while hiring is still in motion. For scaling teams, that means seeing stalled roles, recruiter overload, slow hiring manager response, and source waste early enough to fix them. It also means tying hiring activity to business outcomes like time saved, lower cost-per-hire, and better delivery against plan.
Here’s the short version:
- Live pipeline views show where candidates are stuck and which roles are at risk.
- Time-to-fill, time-to-hire, and SLA tracking show where process delays are costing you time.
- Recruiter load data shows when hiring demand is outgrowing team capacity.
- Source and cost-per-hire reporting in $USD shows where budget is working and where it is being wasted.
- Focused dashboards help recruiters act daily, while leaders track hiring pace, spend, and headcount risk.
- Embedded recruitment can help you put this into practice faster by adding recruiter capacity and tighter process control.
A few numbers make the case. SHRM benchmarking cited in the article shows a 67% increase in median requisitions per recruiter in extra-large organisations, with median time-to-fill at 39 calendar days for non-executive roles. Average cost-per-hire is often in the $4,100 to $5,475 range, and weak source mix can push that much higher.
The point is simple: when hiring scales, static reporting stops being enough. The rest of this guide shows how I’d use live analytics to spot bottlenecks, forecast capacity, and make hiring decisions with more control.
How to use Recruitment Reporting and Analytics in your ATS: Dashboards, Custom Reports and AI
sbb-itb-a23bd6a
The Core Metrics That Drive High-Volume Hiring Decisions
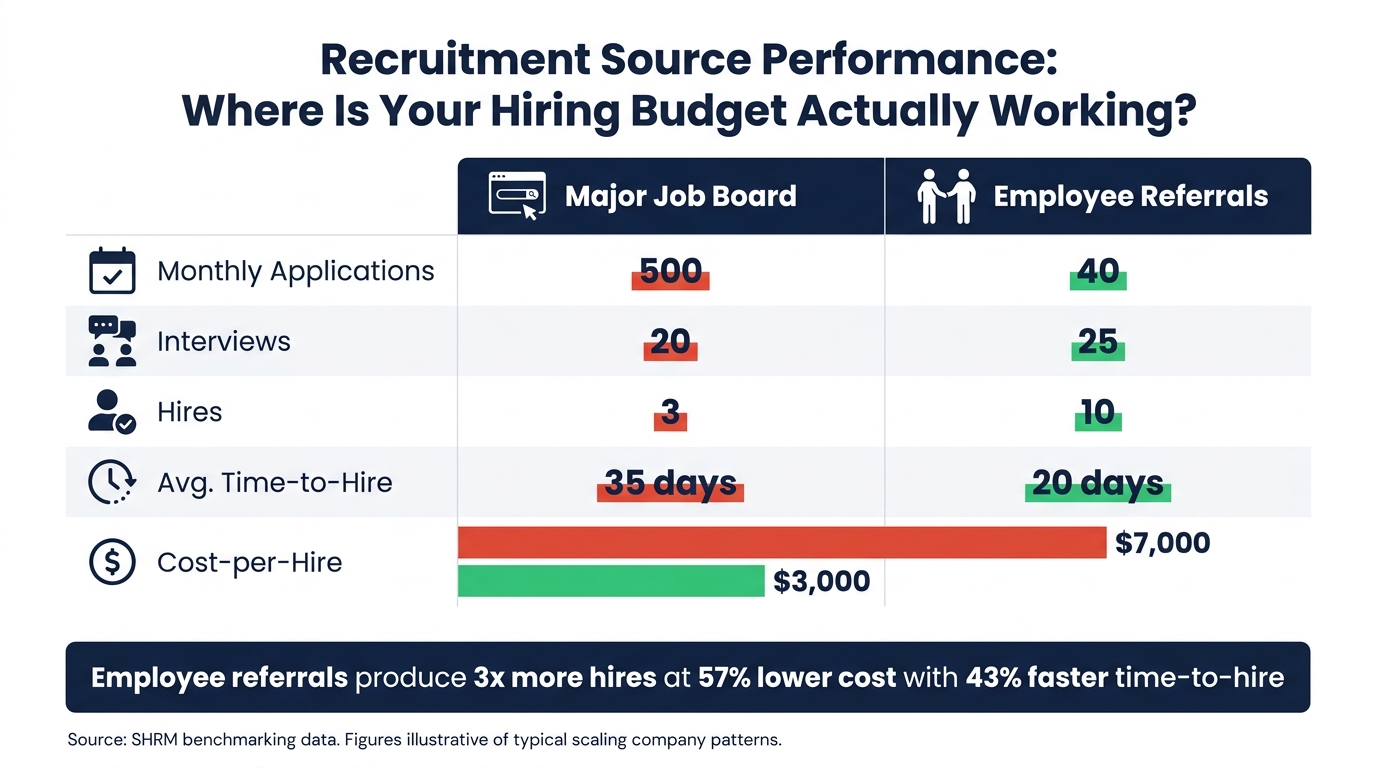
Job Board vs. Employee Referrals: Recruitment Source Performance Compared
These metrics turn real-time analytics into daily hiring decisions.
Pipeline Volume, Funnel Conversion, and Candidate Aging
High-volume hiring comes back to one practical question: is your pipeline deep enough to hit target?
Pipeline volume answers that fast. It shows candidate counts by role, department, and stage, so your team can see where demand is building and where the funnel is running thin. That gives recruiters a clear signal on when to source harder, shift focus to a higher-priority role, or pause a lower-value opening.
A simple way to make this useful is to set minimum stage counts by role. Once those thresholds are in place, recruiters know what "underfilled" looks like. When a dashboard shows counts below target, action is immediate.
Stage-to-stage conversion rates then show why the funnel is leaking. If application-to-screen conversion looks strong, but interview-to-offer conversion falls off a cliff, sourcing may not be the issue at all. More often, it points to poor alignment on what good looks like, or inconsistent interviews across hiring managers.
Track conversion by:
- Role
- Department
- Source
That makes it much easier to spot the exact point where candidates are dropping out, instead of guessing.
Candidate aging matters just as much. Track median days in stage and the share of candidates that sit past SLA. If candidates are waiting too long, the risk is obvious: drop-off, slower hiring, and damage to employer brand.
A color-coded aging heatmap works well here. If it flags candidates sitting more than 72 hours without interview feedback, your team can step in before momentum is lost.
Once volume is visible, the next issue is speed.
Time-to-Hire, Time-to-Fill, Recruiter Load, and SLA Performance
Time-to-fill and time-to-hire sound similar, but they show two different parts of the process.
Time-to-fill tracks days from requisition approval to accepted offer. That shows total vacancy exposure, which matters to finance, delivery, and team output.
Time-to-hire tracks days from a candidate’s first contact to accepted offer. That shows how well your team moves once a person enters the process.
You need both, because each one points to a different business problem.
Track timestamps at each stage so delays are easy to find. A U.S. tech company, for example, might see that average time from application to first recruiter contact is 4 days, while time from final interview to offer approval stretches to 7 days because finance sign-off is slow. Those are not the same issue. One points to recruiter capacity. The other points to process design, which you can audit to find specific bottlenecks.
Recruiter load shows when hiring plans are outgrowing team capacity. Track open requisitions per recruiter and active candidates per recruiter. Then set live load limits by role family and seniority, so you can see when the team is stretched before service levels slip.
SHRM’s 2026 benchmarking data found that extra-large organizations saw a 67% increase in median requisitions per recruiter, which shows how fast workload can outpace capacity without live visibility [2].
SLA tracking adds an early warning layer. A metric like the percentage of candidates receiving feedback within 72 hours tells leaders whether the process is holding up day to day. If that number drops to 60%, the issue is visible straight away, not weeks later when missed hires start showing up in reporting.
When speed is clear, the next step is cost.
Cost-Per-Hire and Source Performance in U.S. Dollar Terms
Cost turns hiring speed into a budget decision.
Cost-per-hire in USD is calculated as total internal and external recruiting costs divided by the number of hires made in a given period. Internal costs include pro-rated recruiter and HR salaries, hiring manager time, referral bonuses, and ATS and sourcing tool subscriptions. External costs include job board spend, advertising, background checks, agency fees, and any embedded recruiting support.
SHRM-linked benchmarking places average cost-per-hire for nonexecutive roles between $4,100 and $5,475, though figures vary a lot by sector and role type [4][3][5].
For scaling companies, the point is not just to know the average. You need cost-per-hire broken down by source and department, so you can move budget toward what is producing hires. Live cost data helps you make that call before the month closes, not after spend is already gone.
Source performance is where this gets commercial. Do not look at application volume alone. A source that sends a flood of applicants can still be a poor use of budget if it does not convert.
What matters is how each source performs across the full funnel:
- Qualified applicants
- Interview rate
- Offer rate
- Hire rate
- Average time-to-hire
- Cost-per-hire
| Source | Monthly Applications | Interviews | Hires | Avg. Time-to-Hire | Cost-per-Hire |
|---|---|---|---|---|---|
| Major job board | 500 | 20 | 3 | 35 days | $7,000 |
| Employee referrals | 40 | 25 | 10 | 20 days | $3,000 |
The gap here is hard to ignore. The job board brings in about 12x more applications, but it produces fewer hires, at more than double the cost, and with a 75% longer time-to-hire.
Without source-level analytics, that kind of imbalance stays hidden. With live dashboards, you can shift budget during the hiring cycle, pause weak ad spend, increase referral bonus visibility, and keep the quarter on track.
How to Design Dashboards That Support Daily Hiring Decisions
Raw metrics only help when the right people see them at the right moment. So build each dashboard around the decision it needs to support. That’s where dashboard design starts, not with charts for the sake of charts.
Operational Dashboards for Recruiters and Hiring Teams
For recruiters, the dashboard should drive today’s work.
A recruiter’s dashboard should answer three questions in under 10 seconds: Which roles need attention right now? Which candidates are stalling? What tasks are overdue?
That means the top of the screen should show a simple summary of what needs action first, like overdue follow-ups, candidates past SLA, and critical roles with zero interviews booked. Below that, the pipeline view should show candidate counts by stage for each open requisition, with clear ageing flags for overdue, at-risk, and on-track items. Upcoming interviews and key events should sit beside that in one calendar view, so things don’t slip during a busy day.
The best operational dashboards keep the main screen tight, 5 to 7 core widgets, then push the rest into drill-downs. If the screen is cluttered, recruiters slow down. Every alert should link straight to the candidate profile or task it affects.
Show stage changes, ageing, and overdue actions live.
Leadership dashboards should roll those signals into trend and budget views.
Leadership Dashboards for Headcount Planning and Hiring Performance
For leaders, the dashboard should show whether hiring is on track.
A leadership dashboard should roll up hiring speed, time-to-fill trends, funnel conversion, offer acceptance rates, and cost-per-hire in U.S. dollar terms, split by team, location, and role level. Use 30, 60, and 90-day trends instead of single-day snapshots. That gives you direction early, before a small issue turns into a hiring miss.
Segmentation is where these dashboards start to pay off. Aggregate data can hide team-level gaps. Break time-to-fill down by function, and you may find one team moves far slower than another. That points to different root causes, which means different fixes. The same applies to offer acceptance rates by hiring manager. If one manager’s numbers are weak, that often signals a breakdown in process discipline or candidate experience at team level, not across the whole business.
Add benchmarks and prior-period comparisons, like target time-to-fill in days, budgeted cost-per-hire, and hires versus plan. That gives leaders context for budget discussions, not just raw numbers.
Dashboard Types, Refresh Rates, and Reporting Tradeoffs
Match dashboard speed to decision speed. Match refresh rate to the decision cycle. Get the timing wrong, and you add cost and noise without helping anyone make better calls.
| Dashboard Type | Primary User | Update Frequency | Key Metrics | Decisions Supported |
|---|---|---|---|---|
| Operational | Recruiters, hiring coordinators | Real-time / hourly | Candidates by stage, overdue tasks, SLA breaches, upcoming interviews | Daily task prioritization, candidate follow-ups, bottleneck response |
| Strategic | HR leaders, TA managers | Daily / weekly | Time-to-fill trends, funnel conversion, recruiter load, source performance | Capacity planning, sourcing adjustments, process improvement |
| Executive | C-suite, finance, business heads | Weekly / monthly | Hires vs. plan, cost-per-hire vs. budget, headcount forecast | Budget allocation, quarterly planning, workforce strategy |
Most scaling companies need a hybrid model: live views for recruiters, batch views for leaders. Not every metric needs a live refresh. Monthly cost-per-hire does not need minute-by-minute updates.
74% of HR leaders report a lack of necessary data to make informed workforce decisions[1]. That gap is rarely a data collection problem. More often, it’s a design problem – the right data exists, but it’s buried in the wrong dashboard, shown to the wrong audience, or refreshed on the wrong schedule.
How Scaling Companies Use Real-Time Analytics to Improve Recruitment Output
Finding Bottlenecks Before Hiring Targets Slip
Operational dashboards help you spot delays before hiring targets start to drift.
Time-in-stage shows where candidates get stuck before time-to-hire starts to slide. If your dashboard shows rising age in one stage, your team can step in the same day instead of waiting for the funnel to break. When candidates sit in "Hiring Manager Review" much longer than other stages, that usually signals a bottleneck that needs action now [6][7], for example, a 48-hour feedback SLA.
Stage-to-stage conversion rates show which handoff is failing. If you see a steep drop from first interview to second interview, the issue is often not sourcing. It is more likely weak screening consistency or a poor experience at that step. Fix that handoff, and you stop losing candidates you have already spent time and money to move through the funnel.
That is often the difference between hitting headcount plan and missing it.
In one documented case, real-time funnel analysis and stage-level bottleneck detection cut time-to-hire from 45 days to 18 days, a 60% reduction across more than 100,000 client requisitions [10][11].
Once those bottlenecks are visible, live data gives you a clearer view of whether the team can still deliver against plan.
Using Live Data for Capacity Planning and Forecasting
The next issue is not just where hiring slowed. It is how much delivery capacity you still have.
Capacity forecasting brings together past close rates by recruiter and role type with live requisitions, pipeline volume, and conversion rates. The math does not need to be fancy to be useful. If your past data shows that 5% of screened candidates become hires, and the team screens 200 qualified candidates a month, you can forecast about 10 hires per month, then adjust that number as live conversion data changes [8][9].
That same forecast is useful during funding rounds, product launches, and new-function builds. It helps you test whether the team can meet hiring demand before pressure lands on the business. It also lets you pressure-test headcount commitments before they turn into budget calls [8].
Without this view, teams make capacity calls on instinct. With it, you can back your hiring plan with numbers, whether you are speaking to finance, the board, or hiring managers waiting on key hires.
Where Embedded Recruitment Support Strengthens Analytics Execution
Having data is not the same as acting on it.
A lot of scaling companies already have dashboards that show the right signals. The gap is execution. Internal recruiters are stretched. They do not always have the time to dig into time-in-stage issues. Hiring managers ignore SLA reminders. Data fields are missed, which makes source performance and cost-per-hire harder to trust.
This is where embedded recruitment support helps. Rent a Recruiter places experienced recruiters into your team, often within days, and they work inside your ATS, dashboards, and hiring process. That adds capacity, but it also brings tighter process control.
You get more consistent inputs across the funnel, including:
- Standardized stages
- Interview kits
- Feedback forms
- SLA definitions
That matters because better input discipline leads to cleaner reporting, stronger forecasting, and faster action when something slips.
"We greatly valued the data and insights they provided, which drove key strategic decisions." – Neil Spellman, Senior Recruiter, Nitro [1]
Because the model uses fixed monthly pricing, clients often cut hiring costs by up to 70% compared with commission-based models [1]. That gives you a clearer link between analytics and business output: faster bottleneck fixes, cleaner forecasts, and tighter hiring control.
That is the point where analytics stops being a reporting layer and starts driving delivery.
Implementation Roadmap and Conclusion
A Simple Rollout Plan for High-Growth SMEs
Once the dashboard design is set, roll analytics out in a clear sequence: define essential recruitment metrics, clean data, connect systems, then build dashboards. Each step turns the pipeline aging, SLAs, recruiter load, and source performance metrics covered earlier in this guide into day-to-day hiring control.
| Step | Owner | Timeline | Impact |
|---|---|---|---|
| Standardize metric definitions (time-to-hire, time-to-fill, cost-per-hire in USD, pipeline stages, candidate aging, recruiter load, SLAs, source performance) | TA Lead / HR Director | Week 1 | Removes ambiguity in reporting |
| Audit and clean ATS stage timestamps | Talent Ops / ATS Admin | Weeks 1 to 2 | Improves time-in-stage accuracy |
| Connect ATS, HRIS, payroll, and sourcing tools | IT / Talent Ops | Weeks 2 to 4 | Removes manual data exports |
| Launch operational dashboard | Talent Ops / Data Analyst | Week 3 | Reduces time spent preparing status updates by 50 to 70% |
| Launch leadership view | Head of Talent / FP&A | Week 4 | Gives leaders a weekly headcount and hiring-risk view |
| Use metrics in daily stand-ups and weekly reviews | Recruiting Lead / Hiring Managers | Ongoing | Increases stage progression rates and cuts candidates sitting untouched beyond 3 business days |
After launch, keep the team on a fixed review rhythm.
Daily: recruiters check pipeline health and aging.
Weekly: the team reviews red and amber pipeline items and at-risk roles.
Monthly: leadership reviews source quality and interviewer load, then adjusts sourcing budgets.
Quarterly: the team steps back to review hiring trends and hiring strategy.
Want to move faster? embedded recruitment support can shrink this timeline to a matter of days.
Conclusion: Build a Faster, More Visible, More Scalable Hiring Function
When these metrics become part of daily work, hiring decisions get faster and clearer.
Real-time analytics changes how scaling teams hire in four concrete ways.
- Speed: live aging data helps teams fix bottlenecks the same day.
- Visibility: leaders can see which roles are on track and which are at risk before hiring targets slip.
- Productivity: recruiters spend less time pulling spreadsheets and more time moving candidates forward.
- Cost control: accurate cost-per-hire and source performance data in USD helps you put budget into channels that produce quality hires at a lower cost.
The path is simple. Agree on definitions, clean your data, connect your systems, and build focused dashboards your team will use every day.
If you want to build that system faster, Book a Call with Rent a Recruiter to get a practical plan tied to your headcount goals. Or See Your Potential Savings to find out how much you could save by moving to a structured, analytics-driven hiring model.
FAQs
What recruitment metrics should we track first?
Start with the core metrics that show how well your hiring pipeline is working:
- Time-to-fill
- Cost-per-hire
- Offer acceptance rate
- Pipeline velocity
These numbers give you a clear view of hiring speed, spend, and conversion. For CEOs, CFOs, and talent leaders, that matters because slow hiring and weak conversion hit growth, team output, and budget fast.
You should also track quality-of-hire. Look at retention beyond 90 days, pass-through rates at each stage, and source effectiveness. That helps you spot bottlenecks, cut wasted time, and put more budget into the channels bringing in the best talent.
How often should hiring dashboards be updated?
Hiring dashboards should be reviewed weekly so you can spot bottlenecks early and keep hiring on track.
For day-to-day changes, review the data weekly. Check channel performance monthly. Then review hiring against broader business goals quarterly.
That rhythm helps you act before small issues turn into missed hires, longer time-to-fill, or wasted spend.
When do we need embedded recruitment support?
You need embedded recruitment support when your internal team is stretched by hiring spikes, or when delays start putting business goals at risk, like product launches or funding milestones.
That matters more than most teams expect. When hiring slips, revenue plans slip with it. Product timelines move. Managers get dragged into admin. Internal teams burn time they don’t have.
It also makes sense if your hiring process is reactive, admin-heavy, or producing mixed results. An embedded recruiter adds immediate capacity and handles hiring end to end, so you can move faster, cut internal strain, and get more control over outcomes.