If your talent pool is not cutting hiring cost or fill time, it is not doing its job.
I look at talent pool ROI in a simple way: what did you spend, what did you save, and did hiring improve? For scaling companies in SaaS, Technology, IT, Fintech, Engineering, Security, Insurance, and Professional Services, the numbers usually come back to three things, lower agency spend, fewer days lost to open roles, and better retention.
Before I calculate anything, I want four inputs locked down:
- Cost-per-hire
- Time-to-fill
- Quality-of-hire
- Attrition and backfill cost
I also want the programme scoped properly. That means:
- focusing on a small set of repeat-hire roles
- setting a clear time period, often a 90-day pilot
- agreeing data owners across TA, Finance, and hiring managers
- comparing pool hires vs non-pool hires
A few numbers shape the business case fast. Average US cost-per-hire sits near $4,683 to $4,700. Median time-to-fill is about 44 days. Agency fees often land at 20% to 25% of salary. If your pool cuts fill time and removes agency use, the return can stack up fast.
Here is the simple test I use: ROI = ((financial gain – total cost) / total cost) x 100.
That gain usually comes from:
- agency fees avoided
- vacancy cost avoided
- lower replacement cost from better retention
If you want a fast way to model the numbers, use this ROI calculator before you put more budget into sourcing, nurture, or tooling.
The rest of the article shows how I would set the baseline, track the right numbers, run the maths, and use the result to decide whether the pool should grow, change, or stop.
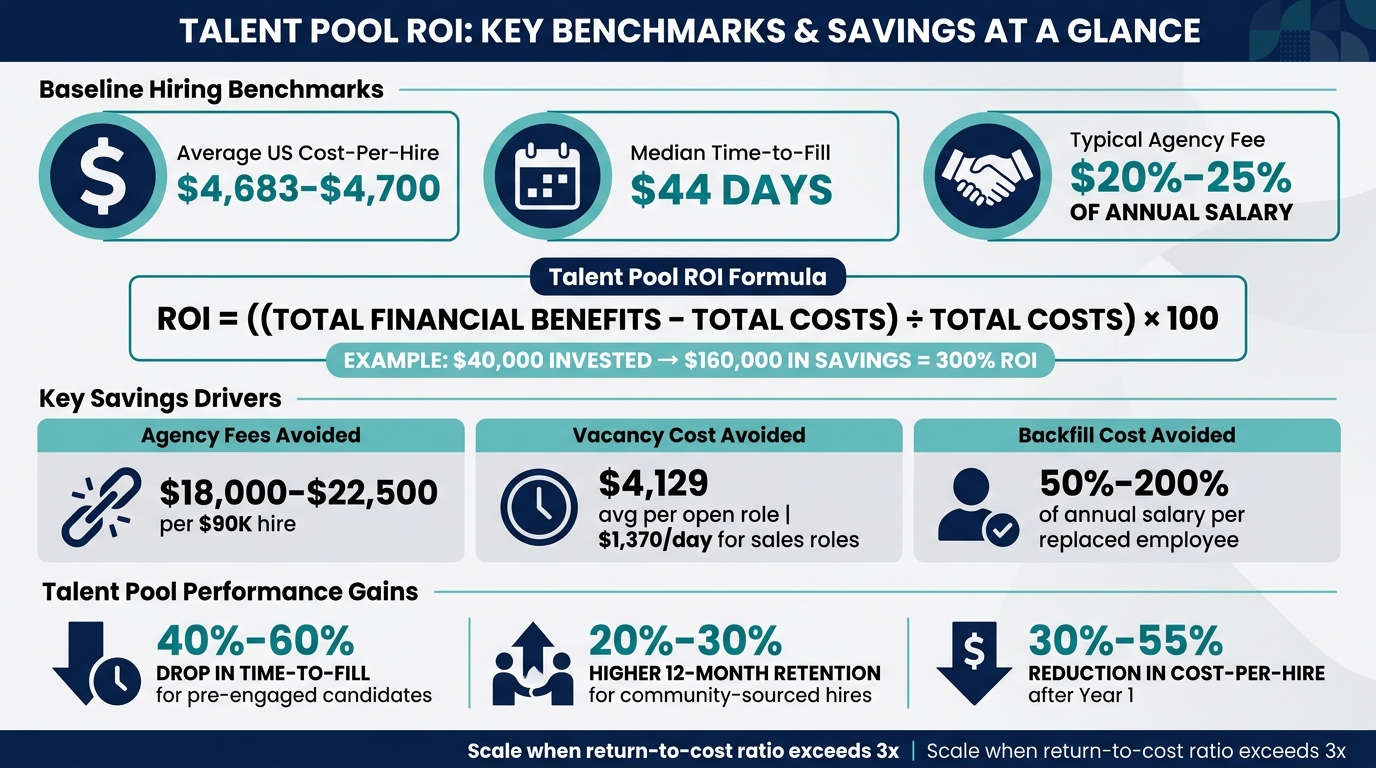
Talent Pool ROI: Key Benchmarks & Savings at a Glance
Recruitment Metrics and ROI | Exclusive Lesson
sbb-itb-a23bd6a
1. Set the scope, goals, and ownership of your talent pool program
Start by getting specific about the problem you want the talent pool to fix. If the scope is vague, the ROI story will be weak. And if the numbers are weak, they won’t shape hiring decisions or survive finance review.
Translate growth plans into measurable hiring goals
Begin with your headcount plan, then work backward from there. You need a clear target for how many qualified, pre-vetted profiles should sit in the pool, and when they need to be ready.
The math matters here. If you need 30 hires, you may need about 91 offers, 606 screens, and 3,030 ready-now candidates [4]. That gives you a practical view of pool depth. It also helps you avoid a common mistake: building a talent pool that looks busy on paper but can’t supply hires when demand hits.
Finance won’t care that you built a database. They will care about outcomes they can track:
- Speed through time-to-fill
- Cost through cost-per-hire
- Quality through 12-month retention
Once the hiring volume is clear, narrow your focus to the roles that will have the biggest effect on hiring output.
Decide which roles and time period to include
Don’t try to pool for every role at once. That’s where teams burn time and get poor data. Focus on the three to five roles you’ve hired most often in the last 24 months [1]. High-volume job families like sales, nursing, or engineering give you enough data to make the ROI case stand up [2].
Then segment the pool in a way your team can use fast. Sort by skill cluster, seniority, location, and readiness so recruiters can move from open role to shortlist without delay [6].
For timing, keep it tight at the start. A 90-day pilot on a single high-volume job family [2] is usually the best place to begin. After that, match reporting to the rhythm your finance and leadership teams already use:
- Monthly for operating metrics
- Quarterly for quality reviews
- Annually for planning [3]
That approach keeps the calculation tied to roles most likely to change hiring output, cost, and time saved.
Assign data ownership across HR, finance, and hiring managers
ROI tracking falls apart when nobody owns the numbers. You need clear accountability across HR, finance, and hiring managers.
| Data Owner | What They Own |
|---|---|
| Talent Acquisition | Sourcing costs, time-to-fill, pipeline conversion rates [3] |
| Finance | Cost baselines and revenue impact data [4][3] |
| Hiring Managers | Quality-of-hire scores, 90-day satisfaction, performance feedback [3] |
Before the program starts, get finance to sign off on the baseline metrics [2]. Do this early, not later.
Lock in your current cost-per-hire first. In the U.S., that sits at about $4,683 to $4,700 [2][3]. Then confirm your median time-to-fill for professional roles, which is 44 days [2].
If you wait and set the baseline after results come in, the ROI case loses trust fast. For CEOs, CFOs, and talent leaders, that’s the difference between a hiring project that gets funded and one that gets picked apart in the next review.
2. Track the right metrics before you calculate ROI
Once finance signs off on your baseline, track only the numbers that change ROI across the roles and time period you set in Section 1. Keep it tight. Focus on four core metrics: sourcing cost, time-to-fill, quality-of-hire, and attrition [2]. Those are the inputs you need before you run the ROI maths.
Core efficiency and cost metrics
The two figures your CFO will care about first are cost-per-hire and time-to-fill. For cost-per-hire, include internal labour, tools, and external fees. If you leave out internal costs, your hiring spend will look lower than it is. In most cases, teams that do this undercount true spend by 30% to 50% [3].
Time-to-fill needs one more step if you want finance to take it seriously. Turn it into a daily vacancy cost by dividing the annual revenue tied to the role by 260 working days [2]. That gives you a dollar figure for every day the seat stays empty. It also makes hiring delays far easier to discuss in a budget review.
Then compare that number across pool-sourced hires and non-pool hires. Companies with mature talent pipelines report a 40% to 60% drop in time-to-fill for pre-engaged candidates [2]. That usually means revenue protected, not just admin time saved.
Next, use funnel performance to show why those gains do, or do not, matter at the business level.
Talent pool funnel and engagement metrics
Pool size on its own is a vanity number. What matters is how people move through the funnel: pool member > applicant > interview > offer > hire. If conversion is weak, a big pool will not help you hit headcount goals.
Use stage-by-stage conversion rates as your funnel benchmark for engineering roles [4]:
| Funnel Stage | Conversion Rate | Candidates Needed per 1 Hire |
|---|---|---|
| Leads (Sourced) | ~18% to "Ready Now" | 32 |
| Ready Now | ~20% to Phone Screen | 28 |
| Phone Screens | ~30% to Manager Review | 3 |
| Manager Review | ~50% to Assessed for Offer | 2 |
| Assessed for Offer | ~33% to Final Offer | 3 |
Track outreach reply rates and click-through rates alongside these funnel numbers. They act as early signs of pool health [2][7]. If response rates are low, the pool is likely to miss hiring targets later. It is far better to spot that early than wait until a quarter closes with roles still open.
Quality and retention metrics
Speed and cost are only half the case. A hire who joins fast, looks cheap, and leaves six months later can wipe out the return. A bad hire can cost 30% to 150% of first-year salary [2][3][8]. That is why quality tracking sits on the value side of the ROI equation.
Use a composite score based on:
- manager satisfaction surveys at 90 days and 12 months
- performance review ratings
- time-to-productivity [3][8]
Then compare those scores for pool-sourced hires against hires from other channels. That tells you whether the gains in speed and cost still hold up after the person is in the seat.
Organizations with structured talent communities report 20% to 30% higher 12-month retention rates for community-sourced hires [2]. That is the kind of figure that helps you defend a talent pool programme when budgets get tight.
Use these metrics as the inputs for the ROI formula.
3. Calculate talent pool ROI step by step
Turn the metrics above into dollars, then compare the total upside with the total cost of the programme.
Add up the total cost of the pool
Before you work out return, build a full cost base. Include recruiter and sourcer time, hiring manager time, tech, employer brand content, data upkeep, compliance work, and event spend.
Use this checklist:
| Cost Category | What to Include |
|---|---|
| Labor | Recruiter sourcing and nurture time; hiring manager interview time |
| Technology | ATS, CRM, AI sourcing tools, assessment platforms, integration fees |
| Marketing | Employer brand content, email/SMS nurture, job board spend |
| Operations | Data enrichment, compliance, training |
| Events | Career fairs, university programs, webinars, networking events, referral bonuses |
Annualise each cost so it matches annual hiring results. If you compare a yearly hiring outcome against partial costs, your ROI figure will be off. That sounds obvious, but it is where a lot of teams get stuck.
Convert gains to dollars
Next, turn the metrics from the previous section into dollar values: sourcing savings, vacancy cost avoided, quality gains, and lower attrition. The aim is simple. You want to show that the pool saves more than it costs.
For agency fees avoided, add up the external spend you did not pay. Recruitment agency fees usually sit between 20% and 25% of a role’s annual salary [2][5]. That means a $90,000 hire can represent $18,000 to $22,500 in fees you kept in the business.
For vacancy cost avoided, convert days saved into a dollar figure. A role left open for 42 days costs a company an average of $4,129, and for revenue-generating roles that cost can double [5]. If your pool shortens time to fill, that gap turns into measurable financial impact.
For backfill cost avoided, include the cost of mis-hires and replacement hiring. A bad hire can cost up to 30% of the employee’s first-year salary [2]. Replacing an employee can cost between 50% and 200% of that salary [6]. Better retention lowers both backfill and replacement costs. Multiply the avoided backfill and replacement spend by the number of hires you retained.
Apply the ROI formula
Once costs and gains are in the same unit, the formula is simple:
ROI = ((Total Financial Benefits – Total Costs) ÷ Total Costs) × 100
Here’s a plain example. If your talent pool programme costs $40,000 per year and delivers $160,000 in savings through lower fees, lower vacancy cost, and lower backfill cost, your ROI is 300%.
Don’t stop at a company-wide average. Read the result by role family or business unit as well. A blended figure can mask where your hiring process is working well, and where it is leaking time or money.
4. Use ROI findings to improve and scale the program
Compare results by role family, seniority, or business unit
Use the ROI inputs from the previous step to see which segments deliver the best returns. Start with the ROI result, then trace it back to the metrics that moved most.
A company-wide ROI number tells you the program is working. Breaking it down by role family, seniority, or business unit shows where the return comes from, and where it falls short. That’s what helps you make better budget calls, especially when deciding between traditional agencies and an embedded recruitment service.
Start by comparing talent pool hires with non-pool hires across three core metrics: time-to-fill, cost-per-hire, and quality-of-hire. Those gaps show where the pool is paying off.
| Metric | Non-Pool Hiring | Talent Pool Hiring |
|---|---|---|
| Time-to-Fill | Your baseline | Your pool result |
| Cost-per-Hire | Your baseline | Your pool result |
| 12-Month Retention | Your baseline | Your pool result |
Then break the results down by role family to see where the gains are coming from. Use segment-level ROI to decide which pools to grow and which to cut back.
| Role Family | Primary ROI Driver | Impact Level |
|---|---|---|
| Sales / Revenue Roles | Shorter time-to-fill, revenue recovered | High |
| Engineering / Tech | Agency fee avoidance, sourcing cost reduction | High |
| Executive / Senior | Quality-of-hire, reduced mis-hire risk | Medium-High |
| Administrative / Support | Process efficiency, internal admin time savings | Medium |
At $1,370 per vacant sales day, cutting time-to-fill by 26 days recovers $35,620 per hire [2].
Prioritize the changes that improve ROI fastest
Once you know where ROI is weak, fix the cause, not the symptom.
When the data points to weak results in one area, the issue usually comes back to one of three things: the pool is too small, the outreach is missing the mark, or the candidate data is out of date.
Underfilled pools show up as a low share of hires from the pool. The fix is simple: increase sourcing volume in that segment so the pipeline stays healthy. Poor outreach shows up in low reply rates. Move outreach to the channels getting better response. Outdated candidate data shows up as slow reactivation times. Talent pool data decays by 20 to 30% a year [1][6], so a six-month refresh cadence is not a nice-to-have, it’s basic upkeep.
Shift budget away from channels and segments that keep underperforming. If one job family shows low conversion and weak retention, narrow spend there and put more into the segments producing the best hiring outcomes.
Build ROI tracking into regular hiring operations
The goal is to make talent pool performance visible every month, not just when someone asks you to defend budget.
Set up a monthly dashboard that tracks pool-to-hire rate and time-to-shortlist at a minimum. Then send finance and leadership a short quarterly ROI summary. Keep it tied to business impact: agency fees avoided, revenue recovered from faster fills, and time saved. Don’t lean on activity numbers like engagement rates if they don’t connect to outcomes.
Review ROI monthly and adjust sourcing, nurture, and refresh cadence based on what the numbers show. Make these metrics part of your monthly hiring review.
Conclusion: Make talent pools accountable to business results
A talent pool should be treated like any other business investment. It should cut hiring costs and reduce vacancy loss.
Use the essential recruitment metrics, baselines, and owners you already have in place to judge whether the pool deserves more budget and attention. Once those targets are clear, ROI gives you a simple way to decide whether to expand, refine, or retire the pool.
In practice, the numbers can be hard to ignore. Cost-per-hire can drop by 30% to 55% after the first year, and when the return-to-cost ratio goes past 3x, that’s a strong sign you should scale [2].
If you want help turning those numbers into a hiring process that works month after month, Rent a Recruiter places experienced recruiters directly into your team. You get more structure, more visibility, and more consistency in how you hire. Book a Call to see where your biggest gains may be.
FAQs
What is a good talent pool ROI?
A good talent pool ROI means the value to your business is higher than the time and money you put into building and running the pipeline.
In most cases, a return starts to hold up at 2x. Strong models often land between 3.5x and 6x in year one.
You can check ROI by looking at the numbers that matter to the business:
- Lower agency fees
- Lower advertising spend
- Less productivity lost to open roles
- Faster hiring
- Better candidate quality
- Lower cost-per-hire
This gives you a clear view of whether your talent pool is saving money, saving time, and helping you make better hires.
How long should I run a talent pool pilot before measuring ROI?
Treat talent pool development as a continuous hiring system, not a one-off project.
That shift matters. When you build pools over time, you cut scramble hiring, shorten search cycles, and give your team a better shot at filling roles without starting from zero each time.
You can start tracking ROI straight away with metrics such as:
- Engagement rates
- Time-to-shortlist
- Pool-to-hire ratios
A mature, high-performing pipeline usually takes 6 to 12 months to build. Once the data starts to settle, keep tracking results and fine-tune your approach so you can confirm ROI with more confidence.
Which roles should I include in a talent pool ROI model first?
Start with the roles your team hires again and again. Focus on the three to five roles you’ve filled most often over the past 24 months. Those roles give you the clearest view of hiring performance and where cost savings are most likely to show up.
This matters for a simple reason: repeat hiring creates better data. You can spot patterns in sourcing, time-to-fill, and spend far more easily when the same roles come up often.
By putting these high-volume roles first, you can show early returns faster. Sourcing becomes more predictable, time-to-fill drops, and you rely less on external agencies.