Turnover is not just a people problem, it is a direct hit to your hiring budget, team output, and growth plan.
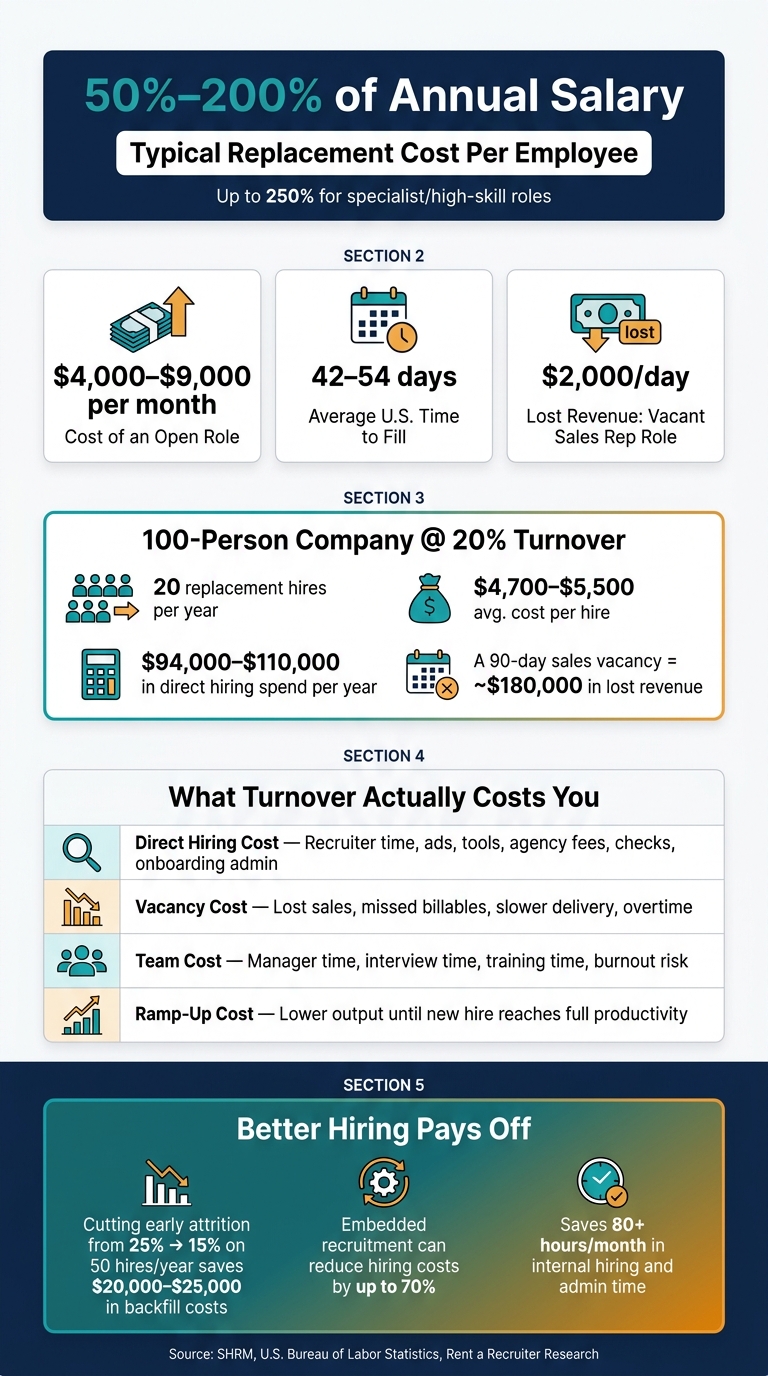
If you run a scaling company, every exit sets off a new cost cycle. You pay again for sourcing, recruiter time, manager time, onboarding, and lost output while the seat is empty. In many cases, replacement cost lands at 50% to 200% of salary, and open roles can drain $4,000 to $9,000 per month before a new hire is in place.
Here is the short version:
- More turnover means more backfills
- More backfills mean more recruiting spend
- Longer vacancies mean lost revenue, delivery delays, and team strain
- Better hiring and lower attrition cut both spend and hiring pressure
For a 100-person business with 20% turnover, that can mean about 20 replacement hires a year. At roughly $4,700 to $5,500 per hire, that is about $94,000 to $110,000 in direct hiring spend alone, before you count manager time or vacancy loss. In sales, the gap can be much bigger. A rep producing $500,000 a year can mean about $2,000 per working day, so a 90-day vacancy may cost close to $180,000 in lost revenue.
What matters most is this: if you track attrition and hiring spend in separate reports, you miss the full cost. You need to look at them together if you want tighter cost control, better hiring outcomes, and more room for growth.
A simple way to think about it:
| Cost area | What it hits |
|---|---|
| Direct hiring cost | Recruiter time, ads, tools, agency or provider fees, checks, onboarding admin |
| Vacancy cost | Lost sales, missed billables, slower delivery, overtime |
| Team cost | Manager time, interview time, training time, burnout risk |
| Ramp-up cost | Lower output until the new hire reaches full pace |
The article below breaks that down in plain terms, so you can see where turnover is costing you money and what to do about it, including when embedded recruitment may give you more hiring capacity at a fixed monthly cost.
The True Cost of Employee Turnover: Key Numbers Every SME Should Know
Turnover and Recruitment Cost Basics
What Turnover Means and Which Type Costs the Most
To measure the cost of turnover, start with the rate itself.
Turnover rate (%) = (Separations ÷ Average headcount) × 100[6][7][8]
If headcount starts at 190, ends at 210, and 30 people leave, annual turnover is 15%.[6][7]
The U.S. Bureau of Labor Statistics groups separations into three buckets: quits (voluntary), layoffs and discharges (involuntary), and other (retirements, transfers, deaths).[9]
For scaling firms, voluntary turnover in high-skill roles usually costs the most.
When a software engineer, SaaS sales executive, fintech product manager, or specialist consultant leaves by choice, you are not just replacing a person. You are reopening a hard-to-fill role, often at a higher salary, with a longer ramp time and a bigger hit to output. That is why these exits create expensive vacancies, not just expensive hires.
Replacement costs for specialist roles can reach 200% to 250% of annual salary once recruiting, onboarding, and lost productivity are included.[16]
Involuntary turnover, such as terminations and layoffs, still creates hiring work. But it is often more planned. For companies in technology, SaaS, fintech, engineering, and professional services, the sharpest financial pressure usually comes from voluntary exits in high-skill positions.
The Recruitment Metrics That Turnover Affects First
Once you know which separations hurt most, the next step is to look at the recruiting metrics that move first.
| Metric | Definition | U.S. Benchmark |
|---|---|---|
| Cost Per Hire (CPH) | Total recruiting costs ÷ number of hires | $4,700 to $5,475 for non-executive roles[10][13][14] |
| Time to Fill | Days from requisition open to offer acceptance | ~42 to 54 days[11][12] |
| Time to Hire | Days from first candidate contact to offer acceptance | Varies by role complexity |
| Cost of Vacancy | Daily revenue impact × number of vacancy days | Role-dependent[15] |
Cost per hire tells you what you spend. Cost of vacancy tells you what the open role is costing the business while nobody is in seat.
Cost per hire covers items such as recruiter salaries, job board spend, agency fees, assessments, and background checks. It does not include the loss tied to an empty role.
That is where cost of vacancy matters. Estimate the role’s daily value, then multiply it by the number of vacancy days.[15]
Here’s a simple example. A professional services consultant with a $300,000 annual billable target contributes about $1,154 per working day ($300,000 ÷ 260). Leave that role open for 30 days, and you could be looking at more than $34,000 in lost billables before you spend a dollar on recruitment.[15]
Time to fill and time to hire are often the first warning signs inside the funnel. SHRM data puts average U.S. time to fill at about 42 to 54 days.[11][12] When turnover rises, recruiters have to juggle more open reqs at the same time. That stretches both metrics and pushes vacancy cost up across several roles at once.
To see the full financial hit, track the whole replacement cost together:
- Recruiting spend
- Vacancy impact
- Hiring manager time
- Ramp-up lag
For a mid-level engineer or account executive, that all-in cost can easily reach 1.5x to 2x annual salary.[16][17]
Looking at these metrics side by side is what makes the cost of turnover clear in commercial terms. A spike in exits does not just affect hiring volume. It hits cost, speed, and output at the same time.
With these metrics in place, the next section shows how high turnover pushes each one up.
sbb-itb-a23bd6a
How Much Does Employee Turnover Cost A Company
How High Turnover Drives Up Recruitment Costs
Those metric shifts show up in two places: direct spend and lost productivity.
Direct Costs: More Backfills, More Sourcing, More Recruiter Hours
Every exit kicks off another hiring cycle. That means more direct recruiting spend every time a role needs to be backfilled.
Those costs add up through recruiter time, job ads, hiring tools, assessments, background checks, scheduling, and onboarding.[19][20][23] On a single hire, the spend may not look dramatic. Across a full year of repeated backfills, it starts to bite.[4]
There’s another problem here. High turnover pushes recruiters into constant reactive work. Instead of building pipelines, lifting candidate quality, or setting up lower-cost sourcing channels, they spend their time replacing people who just left.[19]
For scaling teams, that has a clear business cost. You’re not just paying to hire again. You’re losing the recruiter capacity that should be helping you hire better and spend less.
The larger cost, though, usually comes from the gap the person leaves behind.
Indirect Costs: Vacancy Loss, Slower Ramp-Up, and Team Disruption
A lot of the biggest costs never show up on a recruitment invoice.
Vacancy cost starts from day one, and it does not stop when the offer is signed. The loss continues until the new hire reaches full productivity.[5][18] In many businesses, that lag is where the money goes.
There’s also the knock-on effect across the team. Managers get pulled into extra oversight. Teams lose know-how. Burnout creeps in as others cover the work. In some cases, that strain leads to another round of exits, which turns one vacancy into a much bigger problem.[2][23]
Put simply, the role sits empty, output drops, and the people still in the business carry the load.
Why the Impact Hits High-Growth SMEs Harder
High-growth SMEs tend to feel vacancies faster because they have less slack in the system, fewer backup hires, and less internal recruiting capacity.[20][23] When several roles open at once, time to fill gets longer, vacancy costs stack up, and pressure starts showing up in delivery and revenue.
The sharpest pain usually lands in technical, revenue, and client-facing roles. Sales, engineering, and client-facing vacancies tend to hit hardest because each open seat slows revenue, delivery, or retention in a direct way.[22][2][5][27]
For scaling companies, this is where the math becomes hard to ignore. Direct replacement spend is only part of the picture. Once you include vacancy loss, the indirect cost often outweighs the direct cost of hiring the replacement.[21][22][24][25][26][27]
That’s why turnover is not just an HR issue. It’s a measurable commercial cost. The next step is to turn that cost into annual dollar terms.
How to Calculate the Cost of Turnover in U.S. Dollars
A Simple Formula for Estimating Annual Replacement Recruiting Spend
Start with your recruiting spend. Then, if you want the full turnover number, add the hidden costs.
Annual replacement recruiting spend = (Average headcount × Annual turnover rate) × Average cost per hire
Use average headcount, annual turnover rate, and cost per hire to estimate annual replacement spend.
Here’s what that looks like in a common SME scenario:
| Company Size | Turnover Rate | Expected Separations | Avg. Cost Per Hire | Annual Replacement Recruiting Spend |
|---|---|---|---|---|
| 100 employees | 20% | 20 | $4,000 | $80,000 |
That gives you a solid baseline. But it still misses a big part of the picture.
What to Include Beyond Cost Per Hire
Cost per hire is the starting point, not the full cost. Job ads, tools, recruiter time, and onboarding admin often make replacement look cheaper than it is.
If you want a more realistic number, add these cost categories:
- Separation costs: severance, accrued PTO payouts, HR processing time, and any legal or compliance fees
- Vacancy costs: lost output while the role stays open; for revenue-generating roles, that cost may not sit inside recruiting spend, but it still hits your bottom line [28][29]
- Manager and team time: hours spent on interviews, onboarding, and early coaching, multiplied by fully loaded hourly cost
- Ramp-up productivity loss: the gap between what a new hire produces and what a fully ramped employee would have delivered
When you put all of that together, the full replacement cost per specialist employee can climb far past the direct recruiting line [2].
Comparison Tables: Seeing the Financial Impact Clearly
Direct vs. Indirect Turnover Costs
| Cost Category | How to Estimate It | Likely Business Impact |
|---|---|---|
| Recruiting (direct) | Job ads + tools + recruiter time or fees | Immediate budget hit; scales with every backfill |
| Separation costs | Severance + PTO payout + HR processing time | About $1,950 per departure in the example |
| Vacancy costs | Lost monthly output × months unfilled | Can exceed $100,000 for a revenue-generating role left open for two months |
| Onboarding & training | Trainer time + materials + equipment + external courses | About $3,000 per hire in the example |
| Manager & team time | Hours spent × fully loaded hourly cost | About $2,250 per hire in the example |
| Ramp-up productivity loss | (Full output – actual output) × months in ramp | About $34,000 per hire in the example |
Once you can see the cost clearly, you’re in a much better position to cut waste, protect team capacity, and reduce turnover at the source.
How to Reduce Turnover and Lower Recruitment Costs
Once you can see the cost of turnover, the next move is simple: reduce exits and stop avoidable backfills.
The fastest gains usually come from three areas: better hiring, stronger retention, and steadier recruiting capacity.
Cut Early Attrition by Hiring Better
Most early exits in the first 90 days or 12 months can be avoided. In most cases, the root cause is clear: poor fit, unclear expectations, or a hiring process that failed to test what good looks like in the role.
Structured interviews and scorecards help you assess every candidate against the same criteria. A good scorecard sets out must-have skills, core competencies, and what success should look like by day 90. That gives interviewers a shared standard and cuts down on mis-hires that lead to repeat backfills.
Realistic job previews matter just as much. When candidates see the day-to-day workflow, the common pressure points, and how the team actually operates before they accept, you reduce mismatched expectations and lower first-year attrition.[35]
The cost impact adds up fast. If you make 50 hires a year at $4,000 per hire, cutting early attrition from 25% to 15% can save about $20,000 to $25,000 in backfill costs alone.
Better hiring reduces early exits. Retention stops those gains from slipping away.
Use Retention and workforce planning to reduce backfill demand
Fewer exits mean fewer backfills. That sounds obvious, but a lot of companies still treat turnover as a hiring issue only. It is also a management and planning issue.
Manager quality has a big effect on voluntary turnover, so it pays to train managers on coaching, feedback, and career conversations.[31][32]
Internal mobility also helps. When employees can grow inside the business, you reduce the need for external hiring and cut backfill pressure.[30][33]
Pay matters too. Regular market reviews and clear salary bands reduce exits linked to compensation concerns.[31][34]
On the planning side, shifting from reactive replacement hiring to a rolling 12-month headcount forecast makes hiring far easier to manage. If you know which roles are coming and when, recruiters can build pipelines ahead of time instead of scrambling to fill urgent gaps. That means fewer rushed backfills and more recruiter time for growth hiring.
Even with strong retention, some backfills will still happen. That is why hiring capacity needs to stay steady.
Build Predictable Hiring Capacity with an Embedded Recruitment Model
When turnover still creates openings, your hiring function needs enough capacity to absorb them without slowing growth.
That is where embedded recruitment can help. Embedded recruiters sit inside your team and manage hiring end to end on a fixed monthly cost. You get steady capacity, lower per-hire spend, and far more control than you usually get from traditional recruitment agencies.
They also help tighten the process by:
- building ongoing pipelines
- standardising intake and interview stages
- reporting on funnel metrics on a regular basis
That gives you a clear view of where hiring stands at any point, which matters when backfills and growth roles are competing for attention.
Rent a Recruiter is built around this model, placing experienced recruiters inside scaling companies across technology, SaaS, fintech, engineering, and professional services. Clients can reduce hiring costs and save more than 80 hours per month in internal hiring and admin time.
Conclusion: Lower Turnover, Lower Hiring Costs, Better Growth Control
Turnover is not just a people issue. It drives up recruitment spend and slows growth. Every exit sets off a backfill process, which adds recruiting costs, vacancy loss, and ramp-up lag.[13][36][3] Across a full year, that drag adds up fast.
The good news is that the levers are clear. Better hiring, stronger onboarding, and sharper workforce planning do more than cut turnover. They also reduce recruitment costs and backfill demand. When fewer people leave, you run fewer hiring cycles, spend less, and free up recruiter time for growth hiring instead of replacement hiring with on-demand recruitment.[19][1]
The aim is simple: fewer exits, fewer backfills, lower cost. If you want to measure turnover cost and build more predictable hiring capacity, Rent a Recruiter can help. Clients typically reduce hiring costs by up to 70% while saving over 80 hours per month in internal hiring and admin time. Book a Call to review your turnover cost and hiring capacity.
FAQs
Which turnover costs are easiest to miss?
The easiest turnover costs to miss are often the indirect, downstream ones.
That includes manager and team time spent on recruiting, interviewing, and onboarding. It also includes lost output while the role sits open, and again while a new hire gets up to speed.
Those costs add up fast. For scaling teams, they hit in two places at once: time lost internally and work that slows down across the business.
Companies also miss the cost of early 45- or 90-day exits. You’ve already paid for sourcing, interviews, onboarding, and internal time, then the hire leaves and you start all over again.
There’s also the 3- to 6-month gap between someone leaving and a replacement being fully in place. That gap rarely shows up cleanly in a budget, but it affects delivery, team capacity, and hiring cost in a very real way.
How can I estimate vacancy cost by role?
Estimate vacancy cost by role in two main ways: lost revenue or lost productivity.
For lost revenue, divide the role’s annual revenue contribution by 220 workdays to get a daily vacancy cost. This works well for sales, billable, and other revenue-linked roles where an empty seat has a direct hit on output.
For lost productivity, use this formula:
(annual salary ÷ 2,000) × 3 × vacant hours
This gives you a simple way to put a dollar figure on delayed work, team drag, and the extra load carried by other people while the role stays open.
Some models use an even simpler benchmark: 1% to 2% of annual salary per week. That’s a handy shortcut if you need a fast estimate for budgeting, headcount planning, or a hiring business case.
When does embedded recruitment make sense?
Embedded recruitment makes sense when you need to scale hiring capacity fast, without adding permanent headcount.
It tends to work best during growth periods, like after funding, around product launches, or during seasonal demand spikes. These are the moments when internal teams hit capacity and hiring quality can start to slip.
If that sounds familiar, the business case is pretty clear. You need more hiring output, but you may not want the cost or long-term commitment of another full-time hire.
It can also be a good fit if you’re making 10 to 24 hires a year and want a more predictable monthly cost. That matters for CEOs, CFOs, and HR leaders who need tighter control over hiring spend, while still keeping delivery on track.
Rent a Recruiter can embed experienced recruiters into your team within days.