If you only track hiring speed, you can fill roles fast and still lose money.
I’d measure recruitment quality with five numbers: quality of hire, time-to-fill, candidate satisfaction, offer acceptance rate, and early turnover. That gives you a clearer view of whether new hires perform, stay, and justify the cost to hire them, which matters when one bad hire can cost 30% of first-year pay, and in some cases much more.
In plain terms, here’s what I’d focus on:
- Quality of hire tells you if new hires meet the mark and stick
- Time-to-fill shows how long open roles drain output
- Candidate satisfaction shows if your process helps or hurts offer acceptance
- Offer acceptance rate flags issues with pay, process, or role clarity
- Early turnover shows whether hiring decisions hold up after day one
For CEOs, CFOs, HR leaders, and Talent leaders, the point is simple: better hiring data helps you cut waste, save manager time, and keep growth on track.
| Metric | What it tells you | Business impact |
|---|---|---|
| Quality of hire | If people perform and stay | Lower backfill cost, better team output |
| Time-to-fill | How long roles stay open | Less lost revenue, less pressure on teams |
| Candidate satisfaction | How your process feels to the market | Better offer outcomes |
| Offer acceptance rate | If offers and process land well | Fewer failed hires, less rework |
| Early turnover | If hires last long enough to pay back cost | Lower churn and lower replacement spend |
Below, I’ll break down how I’d define each metric, collect clean data, and use it to fix weak spots in the hiring process.
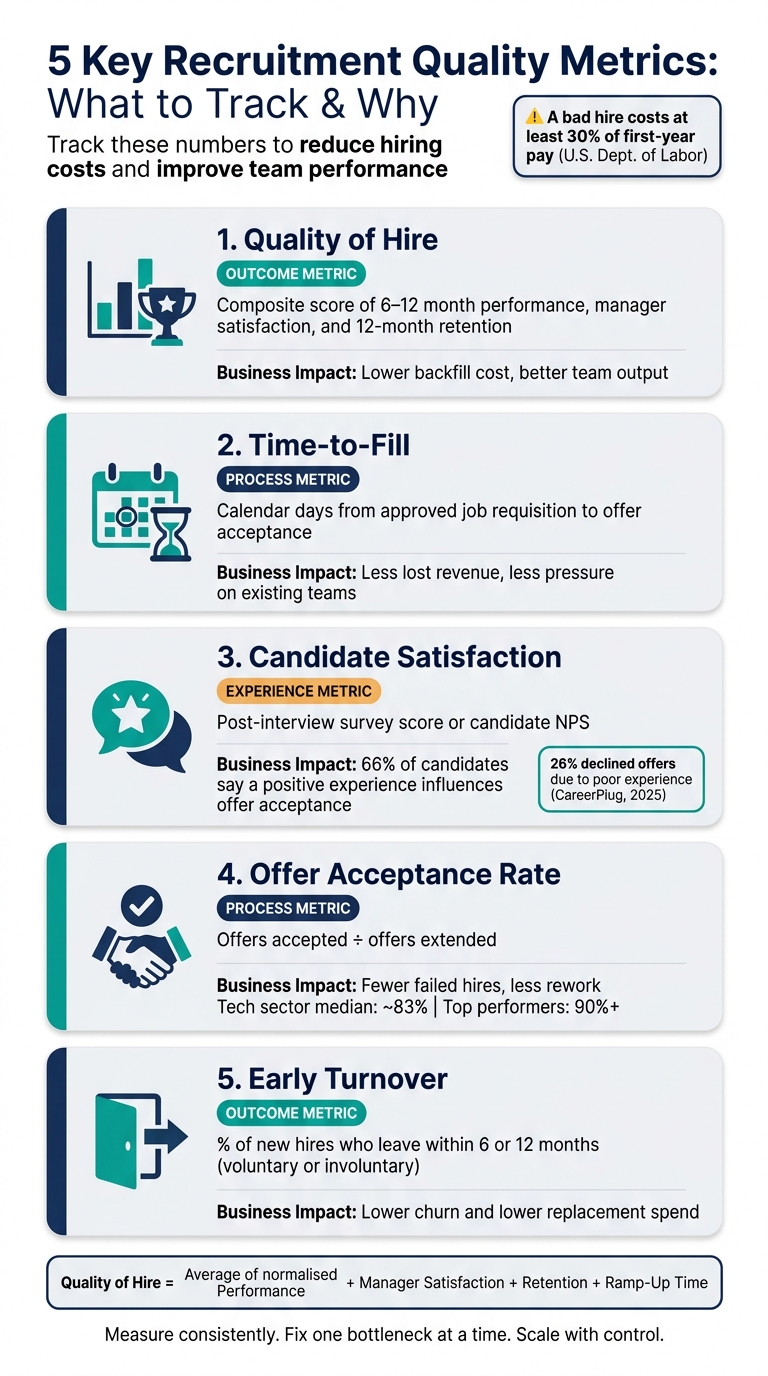
5 Key Recruitment Quality Metrics: What to Track & Why
How to Measure Quality of Hire with a Manager Check-In Rubric in Excel | Analytics for HR
1. Define what recruitment quality means in your company
Before you report on hiring quality, decide what a good hire looks like in clear, measurable terms. If you skip this step, every team will judge quality in its own way, and your data won’t mean much.
A simple starting point is this: a good hire reaches target productivity within an agreed ramp-up period, earns a meets expectations rating or better in their first review, and stays for at least 12 months. Start with one company-wide definition, then adjust the detail by role.
Link hiring quality to business outcomes
Use one framework across the business, but set each measure by function.
For example:
- Sales: quota attainment by month 6 and ARR contribution
- Engineering: cycle time, defect rates, and feature throughput in year one
- Customer success: churn and NPS on managed accounts
This matters because hiring quality isn’t just an HR metric. It affects revenue, delivery speed, retention, and team output. If your definition of quality doesn’t connect to business results, it becomes hard for CEOs, CFOs, and hiring leaders to act on it.
Once the framework is set, document the exact terms your reports will use.
Set shared definitions before you start reporting
Misaligned definitions make recruitment data unreliable. If one team counts time-to-fill from requisition approval and another starts from the first interview, you’re comparing apples to oranges.
Agree on exact definitions before you build any dashboard. For example:
| Term | Standard Definition |
|---|---|
| Time-to-fill | Calendar days from approved job requisition to accepted offer |
| Time-to-hire | Calendar days from candidate application to offer acceptance |
| Early turnover | Any departure, voluntary or involuntary, within the first 12 months |
| Qualified candidate | Meets baseline criteria and passes initial screening |
| Offer acceptance rate | Offers accepted ÷ offers extended |
Document these definitions in an internal playbook. Build them into your ATS field names. Review them at least once a year.
That gives you cleaner reporting, better year-over-year comparisons, and fewer debates about what the numbers mean.
With definitions fixed, you can track the core metrics with confidence.
2. Track the core metrics that show recruitment quality
Once your definitions are clear, turn them into a small, focused dashboard. You do not need to track everything. You need to track the few metrics that tell you if people perform, stay, and add value.
A good dashboard usually covers three areas: outcomes, process, and experience. The point is consistency. If your team measures these the same way every time, you can spot what is working, what is slipping, and where hiring costs are starting to build.
Quality of hire: the main outcome metric
Quality of hire is the clearest way to judge whether recruitment is doing its job.
A simple way to measure it is to use a composite score built from first-year performance, manager satisfaction, 12-month retention, and ramp-up time, all normalised to the same scale. In simple terms:
Quality of hire = average of normalised performance, manager satisfaction, retention, and ramp-up time.
Ramp-up time means the time to first meaningful KPI. For sales, that might be quota. For professional services, it could be billable hours. The key is to measure it the same way by role, team, and hiring cohort.
Why does this matter? Because bad hires cost money fast. Salary is only part of it. You also lose manager time, team output, and momentum. Quality of hire helps you spot those issues before the cost snowballs.[3][4]
Put simply, quality of hire tells you if the person performs and stays. Time-to-fill tells you how fast you got there.
Time-to-fill and candidate satisfaction: the process signals
Time-to-fill measures calendar days from approved job requisition to offer acceptance.
That number has a direct business impact. If a revenue-driving role sits open, pipeline coverage and output take a hit. If engineering or delivery roles stay open too long, projects slow down and existing staff carry more load. Leave that unchecked, and attrition can creep in.
Candidate satisfaction gives you a read on how your process lands in the market. A short post-interview survey works well here. Ask candidates to rate their experience and whether they would recommend your process to others. That gives you direct feedback on communication, fairness, and clarity of expectations.
CareerPlug‘s 2025 candidate experience study found that 66% of candidates said a positive experience influenced their decision to accept a job offer, while poor experiences led 26% of job seekers to decline offers in 2024.[1]
That has a straight line to offer acceptance and your ability to win strong candidates.
Two supporting metrics help round out the picture:
- Offer acceptance rate shows whether compensation, role clarity, and your process are landing well. In the technology sector, the median acceptance rate is around 83%, with stronger companies reaching 90% or more.[2][5]
- Early turnover shows whether hiring decisions hold up once someone joins. If this number is creeping up, it often points to mismatched expectations or weak onboarding.
Core recruitment quality metrics at a glance
Use the table below to standardise how each metric is measured and owned.
| Metric | Definition | Main Data Source | Reporting Owner | What a Strong Result Indicates |
|---|---|---|---|---|
| Quality of hire | Composite of 6–12 month performance rating, manager satisfaction, and 12-month retention | HRIS + performance management system | HR / People Ops | High-performing hires who stay and contribute value |
| Time-to-fill | Calendar days from approved job requisition to offer acceptance | ATS | Talent Acquisition | Roles filled efficiently without prolonged vacancies |
| Candidate satisfaction | Average survey score or candidate NPS post-interview | Candidate surveys | Talent Acquisition | Positive process experience and strong employer perception |
| Offer acceptance rate | Offers accepted ÷ offers extended | ATS | Talent Acquisition | Competitive offers and well-aligned candidate expectations |
| Early turnover | % of new hires who leave within 6 or 12 months | HRIS | HR / People Ops | Sustainable hiring decisions and effective onboarding |
These metrics only help if the data behind them is clean and comparable. If one team measures manager satisfaction one way and another team does it differently, the numbers will tell you very little. Before you compare results across roles, teams, or hiring periods, clean the data first.
sbb-itb-a23bd6a
3. Collect clean data and read it correctly
Once your metrics are set, the next job is making sure the data behind them is solid. If the inputs are messy, patchy, or owned by no one, the output will point you in the wrong direction.
Where to source your recruitment data
Pull recruitment data from five places: your ATS, hiring manager scorecards, onboarding check-ins, probation reviews, and candidate surveys.
Each source supports a different part of the picture. Your ATS tracks stage timestamps and source tags, which feed time-to-fill and conversion rates. Hiring manager scorecards and probation reviews help measure quality of hire. Candidate surveys feed satisfaction scores. And 30-, 60-, and 90-day check-ins help you track ramp-up speed before formal reviews land.
This is where many hiring teams run into trouble. Recruiters miss source tags. Hiring managers send scorecards late. Onboarding check-ins slip when workloads pile up. Then six months later, leadership wants answers, and the data is full of holes.
The fix is simple, but it needs discipline. Make data entry a required part of the hiring process, not an optional admin task.
- Configure your ATS so key fields must be completed before a candidate can move forward, including source, stage change, and rejection reason
- Set clear ownership: recruiters own pipeline data, hiring managers own scorecards, and HR or People Ops own post-hire reviews
- Run a monthly audit to catch missing fields before they become gaps you can’t fill later
If you want clean reporting, you need clean habits. No one gets useful hiring data by accident.
Read trends by role, team, and time period
Use 3- or 6-month rolling averages to smooth out noise, especially when hiring volume is low. A single hire, or one delayed role, can skew the picture fast.
Group data by role family, like engineering, sales, or customer success, instead of mixing it all together. Benchmarks vary a lot by function, so blended reporting can hide where the issue sits. A 45-day fill time may be fine for one team and a major drag on another.
For low-volume hiring, treat results as directional rather than final. You’re looking for signals, not certainty.
A heat map can help you spot problem areas fast. Set departments as rows and metrics as columns, then review time-to-fill, quality of hire, early turnover, and candidate satisfaction side by side. That makes it much easier to see where delays, weak hires, or drop-offs are stacking up.
When you change a process, mark the date and compare the three months before and after. That’s how you connect hiring activity to business impact, whether that’s lower time-to-fill, better early retention, or less wasted manager time. Those patterns usually show you where to fix the process next.
4. Use the data to improve recruitment quality
Fix the parts of the process that lower quality
Once your data is clean and your trends are clear, the job changes. You stop measuring for the sake of measuring, and start fixing what hurts hiring outcomes.
Don’t try to repair everything at once. Pick one or two bottlenecks first. Start where the data shows a clear problem and where your team can make a practical change without months of debate.
A few areas tend to have the biggest effect early on.
Job briefs are often where quality slips first. If hiring managers keep rejecting shortlist candidates, or new hires miss early targets, the brief is usually too loose or off target. The fix is simple: turn vague expectations into measurable outcomes. For example, instead of asking for a "strong sales profile", define success as close 4 deals per quarter at an average contract value of $50,000. Split must-haves from nice-to-haves. That helps recruiters screen with more accuracy from day one, and it can also cut time-to-fill.
Interviewer calibration is another weak point for many teams. If one interviewer rejects 80% of candidates while others approve 60%, your process isn’t scoring people in the same way. That’s a quality problem, not just a people problem. Structured interviews help reduce that gap. Use standard questions, competency-based scorecards, and short calibration sessions before interviews start. Research from the U.S. Office of Personnel Management shows that higher-structure interviews have higher validity and consistent scoring across interviewers.[6]
Feedback delays do more damage than most teams think. They slow time-to-fill and hurt offer acceptance at the same time. Negative interview interactions and unclear communication directly cost offers.[1] A 24-hour SLA for post-interview feedback, automated ATS reminders, and fewer decision-makers can cut delay without weakening assessment quality.
It also helps to review your interview funnel for overlap. If a "culture interview" is asking the same things as the behavioural round, combine them. In practice, moving from five stages to three and cutting time-to-fill from 55 to 40 days can make the process leaner while keeping quality of hire steady. Candidates also tend to rate shorter, more focused processes more highly.
Build a repeatable hiring system as demand grows
Once you’ve fixed the weak points, the next step is to turn those changes into one repeatable system.
As hiring demand grows, inconsistency gets expensive. Different teams using different scorecards, timelines, and decision rules leads to slower hiring, more admin, and weaker data. You need one hiring system that can scale with the business.
That usually means:
- One hiring playbook
- Standard scorecards
- Clear ownership at each stage
- Automated reporting
Some parts will still change by role. Technical assessments, sourcing channels, and team input won’t look the same for every hire. That’s fine. But the core framework should stay in place across the business: structured interviews, feedback SLAs, and consistent data capture.
If you need help putting that into practice at scale, embedded recruiters can speed up the rollout. They can help your team put the playbook in place, roll out scorecards, and keep reporting on track without dragging the work out across multiple quarters.
Conclusion: Measure consistently, improve steadily, and scale with control
Recruitment quality is not a single metric. It comes from looking at quality of hire, time-to-fill, and candidate experience together. That gives you a much clearer view of what is working, what is slowing you down, and where hiring risk is starting to creep in.
The next step is simple. Use the same metrics every time, then act on the patterns in the data.
Start with four actions:
- Define what good looks like
- Pick a small set of metrics
- Keep your data clean
- Review results monthly or quarterly
Then fix one bottleneck and measure the change. That’s how you improve hiring without losing control of cost or speed.
A bad hire is expensive. The U.S. Department of Labor estimates that a bad hire costs at least 30% of that employee’s first-year earnings.[7] For growing teams, that can mean wasted salary, lost time, lower output, and more pressure on managers. A consistent measurement system is one of the most direct ways to cut that risk.
As hiring volume grows, messy processes get expensive fast. A repeatable hiring system, built on clear definitions and honest data, gives you more control over growth instead of leaving you stuck in reaction mode.
If you need help building a more structured hiring system, Rent a Recruiter can place recruiters into your team and manage hiring end to end. Book a call to get started.
FAQs
How do you calculate quality of hire?
Quality of hire is usually measured by looking at a few clear signs of new-hire success.
A common method is to take the average of:
- the 90-day performance review score
- hiring manager satisfaction on a 1 to 5 scale
- a retention score
That gives you a simple way to track whether new hires are working out, not just whether roles are getting filled.
If you want a bit more control, you can use a weighted model instead. For example:
- 90-day retention: 40%
- time-to-ramp: 30%
- hiring manager satisfaction: 20%
- first-quarter KPI performance: 10%
This kind of model helps you tie hiring back to business results. Not all inputs matter equally. Retention and ramp time often tell you more about hiring success than a single satisfaction score, especially if you’re scaling fast and need new hires to perform in role without long delays.
What if hiring volume is low?
When hiring volume is low, keep the process simple. You do not need a heavy reporting setup to stay on top of performance.
If you hire fewer than 10 people a year, a 30-minute quarterly review is usually enough to spot patterns early. If you hire between 5 and 20 people a year, track four core metrics:
- Cost per hire
- Time-to-fill
- Offer acceptance rate
- 90-day retention
That gives you a clear view of hiring cost, speed, and quality, without adding admin your team does not need.
Low volume can also hide different problems. If the issue is too few candidates, look at your source mix and where applicants are coming from. If application quality is strong but conversion is weak, the problem is likely inside the process, such as review capacity, interview quality, or slow decision-making.
For CEOs, CFOs, and talent leaders, that matters because even a small number of missed hires can drag out delivery, stretch teams, and add avoidable cost.
How often should we review these metrics?
Use a tiered review rhythm that matches your hiring volume and the metrics you track.
- Weekly: pipeline health, candidate bottlenecks, and roles that have gone past service-level agreements
- Monthly: cost per hire, time to fill, and source effectiveness
- Quarterly: quality of hire, retention trends, and overall process integrity
This gives you a clear cadence for spotting issues early, tightening delivery, and keeping hiring tied to both short-term targets and longer-term business goals.