If your hiring process is slow, candidates drop out, and offer acceptance is falling, you do not have a sourcing problem. You have a process visibility problem.
I’d sum it up like this: candidate experience diagnostics helps you find exactly where your hiring process is losing time, money, and strong applicants. It gives you a simple way to track friction across the careers page, application, screening, interviews, offer, and onboarding, so you can fix the stages that hurt hiring results most.
For scaling companies in SaaS, IT, fintech, engineering, security, insurance, and professional services, that matters fast. The average time-to-fill sits at 42 to 45 days. Application completion is only about 34%. Candidates who get weekly updates are 80% more likely to accept an offer. And if an offer goes out within 5 days of the final interview, acceptance can be 2x higher.
Here’s the short version:
- Map the full hiring journey to find where delays start
- Track stage-level metrics like drop-off, time to first response, and offer acceptance
- Use short surveys after key stages to learn what is driving exits
- Run a fixed review cycle to act on the top 2 or 3 friction points
- Add delivery capacity if your internal team cannot keep the process moving
The point is simple: when you can see where hiring breaks down, you can cut wasted time, reduce vacancy cost, and improve offer acceptance without adding more noise or admin.
Below, I’ll break down the framework in plain terms so you can see what to measure, what to fix first, and when extra support such as embedded recruitment may make sense.
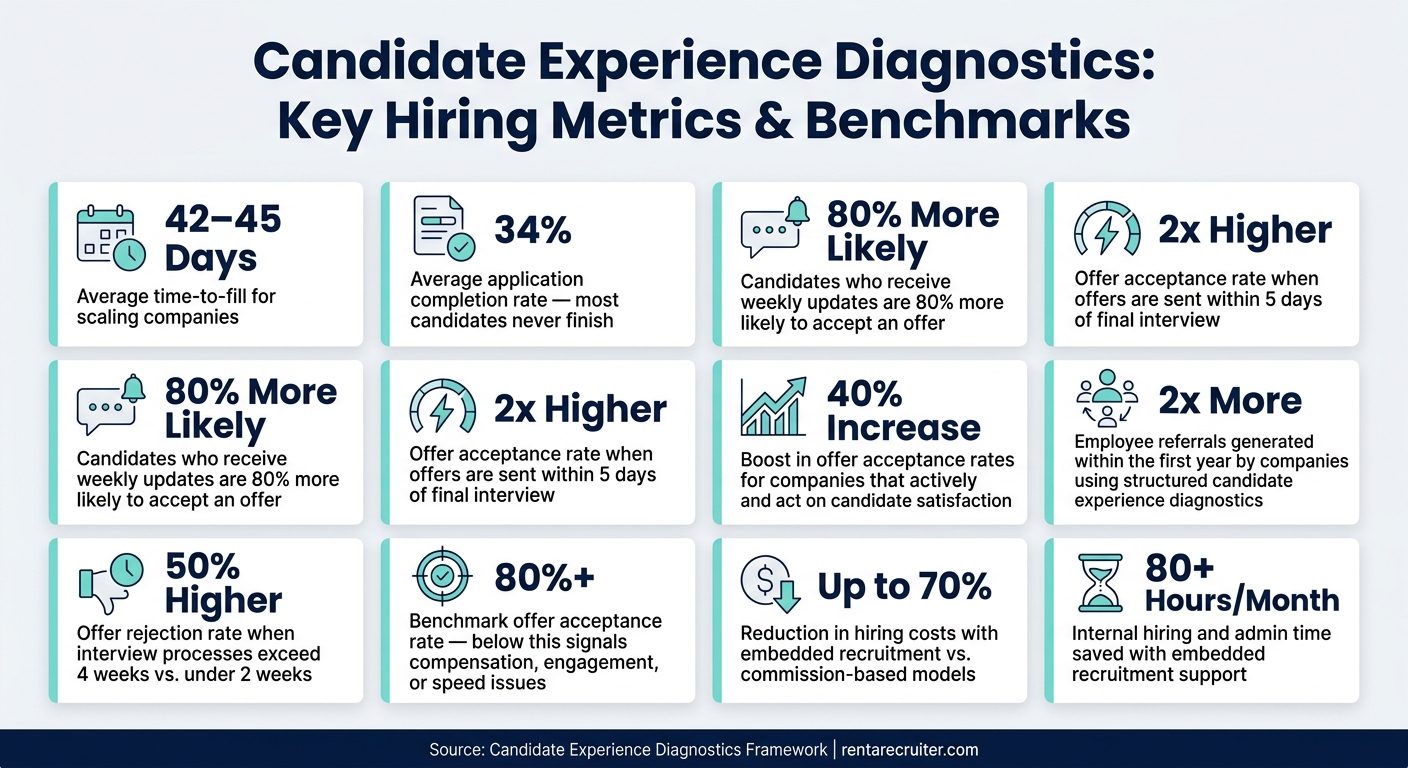
Candidate Experience Diagnostics: Key Hiring Metrics & Benchmarks
Map the Candidate Journey and Find Friction Points
Most hiring problems show up at the same handoffs, again and again. If you map the candidate journey, you can see where friction starts, and where it builds into delays, drop-off, and poor candidate experience. Once that journey is clear, the next move is simple: give each handoff one owner.
Journey Stages, Touchpoints, and Who Owns Them
The full journey runs from awareness and consideration through application, screening, interviewing, offer, and onboarding. Each stage needs a clear owner, yet this is where many scaling companies lose control.
Set ownership clearly:
- Recruiter or talent acquisition lead for sourcing, screening, and candidate communication
- Hiring manager for interview quality and feedback
- HR or a coordinator for scheduling and offers
- HR or onboarding for preboarding and final handoff
When ownership is clear, it becomes much easier to spot where delays begin, who needs to act, and why candidates start to feel ignored.
Candidate Personas, Emotions, and Pain Points by Stage
Not every candidate moves through your process in the same way. An experienced technical hire sourced on LinkedIn expects something very different from an entry-level applicant who found the role on your careers page. If you build personas based on recent hires, source channel, and role type, you can spot stage-by-stage friction and see which groups are dropping out most often.
Each persona should reflect what the candidate is likely thinking and feeling at each point in the journey.
At awareness, candidates are judging whether your company looks credible and worth their time. During application, frustration climbs when the form is too long, hard to use on mobile, or asks for details already sitting on the resume. In screening, silence is often the problem. Slow replies or vague updates make candidates read the process as disorganised or lacking interest. By the offer stage, pressure shifts to compensation clarity, decision speed, and competing offers. Then in onboarding, disappointment can creep in if the role sold during hiring does not match reality, or if the first week feels messy and underprepared.
Map those emotions by stage and you get a much better answer to the real problem. You see not just where candidates leave, but why they do.
Comparison Table: Journey Stage vs. Pain Point vs. Diagnostic Data Source
| Journey Stage | Typical SME Pain Point | Diagnostic Data Source |
|---|---|---|
| Awareness & Consideration | Weak employer brand; low attraction from target candidates | Career site analytics; employer branding assessment |
| Application | Too many steps; poor mobile experience; duplicate data entry | Application drop-off rates; career site analytics |
| Screening | Slow time to first response; generic or no communication | ATS stage timestamps; recruiter notes |
| Interviewing | Inconsistent interviewer feedback; role scope shifts mid-process | Interview scorecards; candidate survey feedback |
| Offer | Candidate hesitation; competing offers; compensation misalignment | Offer acceptance rate; recruiter notes; candidate survey feedback |
| Onboarding | Weak handoff from hiring to HR; overpromised role reality | Onboarding check-ins; early turnover metrics |
Use more than one data source before you change the process. That helps you confirm the real cause, instead of fixing the wrong thing. These friction points show you what to measure next, or you can rate your recruitment process to identify specific gaps immediately.
sbb-itb-a23bd6a
Measure Candidate Experience with Data and Surveys
Mapping shows where friction appears. Measurement shows how often it happens and how much it costs you in drop-off. Use funnel data with candidate feedback to confirm the cause. Once friction points are mapped, the next step is to measure which ones are driving the most loss.
Core Metrics That Show Where the Hiring Process Is Failing
Every scaling SME should track a small set of metrics that show where candidates are leaving the process. The average application completion rate is about 34%, which means most people who start an application never finish it.[5] That can point to a broken form, poor mobile usability, or too many steps in the application flow.
Beyond that, stage-level drop-off rate shows where candidates exit. Time to first response shows how fast your team engages after someone applies. Both matter because speed shapes outcomes.
The business case is simple. Candidates who receive offers within 5 days of their final interview accept at twice the rate of those who wait two or more weeks.[1] Interview processes that run past four weeks see about 50% higher offer rejection rates than those finished in under two weeks.[1]
An offer acceptance rate of around 80% or higher is a useful benchmark.[7] If you’re below that, the problem is often one of three things:
- Compensation does not match the market
- Candidate engagement drops during the process
- Internal decision-making is too slow
Taken together, time to hire, candidate satisfaction, and onboarding signals give hiring leaders a clear view of speed, quality, and follow-through, without getting buried in dashboards.
How to Design Stage-Specific Candidate Surveys That Get Usable Feedback
A generic end-of-process survey misses most of what matters. If you want feedback you can act on, use stage-specific surveys while the experience is still fresh.
Keep surveys to 3 to 10 questions, depending on the stage, and send them within 24 to 48 hours of each milestone.[4][6] Make them mobile-friendly. Most candidates now deal with hiring on their phones.[3][8]
Protect anonymity where you can. People give more honest answers when they do not think feedback could hurt a future opening.
Ask about specific moments in the process. For example, ask what almost stopped them from finishing the application, or what mattered most in their choice to accept or decline the offer. Use a mix of rating scales and short open-text answers. The ratings show the size of the issue. The comments tell you what’s behind it.
Comparison Tables: Quantitative vs. Qualitative Methods and Survey Types by Stage
| Method Type | Data Source | Strengths | Limitations | Best Use Case |
|---|---|---|---|---|
| Quantitative | ATS funnel reports, stage timestamps, survey ratings | Spots patterns at scale; tracks improvement over time | Doesn’t explain why problems occur | Locating where drop-off or delays happen |
| Qualitative | Open-text survey responses, recruiter notes, candidate interviews | Explains root causes; shows specific friction | Hard to scale; prone to selection bias | Understanding the reason behind a metric |
Use both. Numbers show where friction sits. Comments explain why.
| Survey Type | Objective | Timing | Question Count | Key Metrics Captured |
|---|---|---|---|---|
| Post-Application | Identify friction in the application flow | Immediately after submission or abandonment | 3–5 | Application completion rate; usability issues; drop-off reasons |
| Post-Interview | Assess clarity, fairness, and responsiveness | Within 24–48 hours of interview | 5–7 | Candidate satisfaction; interviewer consistency; communication quality |
| Post-Offer | Understand why candidates accept or decline an offer | Shortly after an offer is accepted or declined | 5–8 | Offer acceptance rate; compensation fit; competitor influence |
| Post-Onboarding | Check whether the hiring promise matched reality | After the first week or first 30 days | 5–10 | Onboarding signals; expectation alignment; early satisfaction |
Response rates vary a lot by stage. Post-offer surveys for hired candidates usually get 50% to 70% response rates when sent quickly, while post-application surveys average 10% to 20%.[4] That gap matters. It helps you decide where survey effort will give you the best return first.
Use those responses to rank the fixes that will remove the most friction first.
Turn Diagnostic Findings into Faster, More Consistent Hiring
Measurement without action is just reporting. Once you know where candidates drop off, and why, the next move is to build a repeatable process that turns those findings into better hiring outcomes.
Use a Closed-Loop Process to Prioritize Improvements
Run a six-step closed loop every month or quarter. Start by pulling stage-level funnel data and candidate feedback. Review patterns in a 60 to 90 minute operations session, then pick the 2 to 3 friction points causing the biggest delays.
From there, set a SMART target for each issue. For example, reduce average time from application to first response from 5 business days to 2 within the next quarter. Give each issue one owner, put the fix in place, and measure the result at the next review.
This matters because small, high-impact changes are easier to land and easier to track. One owner per friction point, one deadline, and one measurable candidate-facing result, that’s what turns a diagnostic into action instead of another report sitting in a folder.
It also keeps the team focused on the exact points the diagnostics flagged, rather than drifting into broad process changes that eat time and deliver little.
Process Changes That Improve Candidate Experience at Scale
Diagnostics tend to flag the same problems across SMEs: slow CV review, patchy interviews, unclear communication, and scheduling delays. The good news is that the fixes are practical.
Role-specific scorecards with 4 to 6 core competencies cut back-and-forth between interviewers and help teams make decisions faster. Recruiter and hiring manager SLAs, such as CVs reviewed within 48 hours and interview feedback logged within 24 hours, make ownership clear and easy to track through ATS timestamps. Standardized communication templates at each stage cut admin time and reduce the silence candidates often mention in surveys. Centralized scheduling, whether through self-serve links or a dedicated coordinator, can strip days out of the process between stages.
When stage data, survey feedback, and recruiter notes all point to the same issue, acting on it has a compounding effect. Organisations that actively measure candidate satisfaction and act on it report a 40% increase in offer acceptance rates and 2x more employee referrals within the first year.[9]
Comparison Table: Ad Hoc Hiring vs. Structured Candidate Experience Diagnostics
| Dimension | Ad Hoc Hiring | Structured Candidate Experience Diagnostics |
|---|---|---|
| Data completeness | Sporadic feedback and basic reports only | Consistent funnel metrics, stage surveys, and recruiter notes every cycle |
| Speed of improvement | Reactive, problems are addressed only when they become urgent | Continuous, regular monthly or quarterly cycles with SMART targets drive incremental gains |
| Candidate perception | Inconsistent and opaque; candidates report confusion and silence | Predictable communication, clearer expectations, and a more professional interview experience |
| Hiring manager ownership | Informal and uneven | SLAs, dashboards, and governance forums make responsiveness visible and owned |
| Reporting visibility | Limited or reactive | Regular stage-by-stage metrics leaders can use to guide headcount planning and process changes |
| Scales under growth spikes | Breaks down under demand spikes | Repeatable and scalable across roles, teams, and locations |
As hiring volume climbs, this cadence only holds if your team has the capacity to keep running it. When the process starts to stretch internal bandwidth, the next issue is capacity.
Build the Capacity to Sustain Diagnostics and Improve Hiring Outcomes
When Internal Teams Need More Hiring Capacity and Structure
Once you know where candidates are dropping out, the next step is simpler, and harder: does your team have enough capacity to keep fixing it?
This is where many diagnostic efforts slow down. Not because the team lacks intent, but because bandwidth disappears. It often happens during hiring spikes, after funding rounds, during product launches, market expansion, or when lean HR and talent teams are already stretched thin.
The warning signs are usually clear. You may see:
- Rising time-to-fill and time-to-offer
- More drop-off between interview stages
- Lower candidate satisfaction scores
- Weaker offer acceptance rates
When recruiters are carrying more than 20 to 25 requisitions each, diagnostic work is often the first thing to slip. [2][12]
To keep diagnostics running, ownership needs to be clear at three levels. One person should keep the journey map up to date. One should run surveys and maintain dashboards. And one leader should review findings on a fixed cadence, then make sure action follows.
How Embedded Recruitment Support Can Strengthen Candidate Experience Diagnostics
If internal bandwidth is the bottleneck, the answer is not more reporting. It is more execution capacity.
An embedded recruiter works inside your team. They keep journey maps current as new roles or markets are added. They make sure surveys go out at the right stages. They keep the monthly review cadence moving, even when hiring managers are buried in product or operations work.
Rent a Recruiter works this way with high-growth SMEs across technology, SaaS, fintech, and engineering. Their recruiters embed directly into the client’s team within days, standardizing touchpoints and putting communication SLAs in place so diagnostics lead to action, not just discussion. Companies typically reduce hiring costs by up to 70% compared with commission-based models, while saving over 80 hours per month in internal hiring and admin time. [10][13]
When you bring in embedded support, set a joint review cadence, monthly or every two weeks. Agree the core metrics up front: time-to-offer, stage-specific drop-off, candidate satisfaction scores, and offer acceptance rate. Then tie that to clear OKRs, such as cutting interview-to-offer time by 20% within 90 days. [3][11]
Conclusion: The Diagnostic Framework to Start With and Your Next Step
Use the findings to decide whether to keep ownership fully in-house or add embedded recruitment support.
Start with a 2 to 3 week baseline audit. Pull your current time-to-offer data. Gather recent candidate feedback. Pinpoint your two or three biggest friction points. Then assign clear diagnostic ownership and keep the process running.
Candidate experience is not a one-off audit. It is a measurable hiring system, and it needs ongoing ownership if you want steady hiring results.
FAQs
How do I know which hiring stage to fix first?
Map your full hiring process in your ATS and look closely at where people slow down or drop out. Focus first on any step with long delays, especially anything sitting for more than five business days. Check time-in-stage and conversion rates so you can see where the process is costing you time, losing good applicants, and dragging out hires.
Then sort fixes by impact versus effort. Go after the quick wins first. For each issue, use the 5 Whys to get to the root cause, so you fix the process itself, not just the symptom.
A slow hiring process rarely comes from one big failure. More often, it’s a few small blockers stacking up, stage by stage.
That matters because every extra day in process can mean lower conversion, more hiring admin, and missed revenue if key roles stay open for too long.
What tools do I need to run candidate experience diagnostics?
You don’t need expensive software. Most SMEs already have the right tools already in place. The gap is usually how those tools are being used, not the tech itself.
Use your ATS to track pipeline speed, stage drop-off, and communication bottlenecks. That gives you a clearer view of where hiring slows down, where candidates are being lost, and where your team is wasting time.
Then layer in a few simple tools around it: scheduling tools to cut admin, standardized scorecards to improve decision-making, and survey tools for cNPS and feedback. Small changes here can save hours each week and help you make better hires with less friction.
Rent a Recruiter also offers a free Recruitment Health Check to benchmark your process and spot gaps.
When should we bring in extra recruiting support?
Bring in extra recruiting support when hiring demand starts to outpace your team’s capacity.
A few signs tend to show up early. You may be hiring more than 5 to 10 roles per quarter. You may be trying to fill niche or hard-to-fill positions. Or your founders and senior leaders may be losing 10 to 20 hours a month to hiring admin instead of spending that time on growth, delivery, or team leadership.
That’s usually the point where recruitment stops being a side task and starts affecting business performance.
It’s also worth getting support if your hiring process feels slow, messy, or hard to control. Maybe good candidates are slipping through the cracks. Maybe drop-off rates are climbing. Maybe roles are staying open far longer than planned.
When that happens, the cost isn’t just recruiter workload. It’s lost time, delayed hires, and more pressure on the people already carrying the process.