If you only track diversity at hire, you miss where hiring cost, delay, and drop-off start.
I’d keep this simple. In 2026, the SaaS teams getting more control over hiring are tracking a short set of funnel metrics: representation by stage, conversion rates by group, adverse impact ratios, offer rates, offer acceptance, pay against salary bands, hiring speed, and early retention. That gives you a clear view of where process gaps show up, where offers are lost, and where first-year attrition starts to erode hiring spend.
For CEOs, CFOs, HR leaders, and Talent Leaders, the point is not more reporting. The point is better hiring outcomes. If one group drops out at screening, takes longer to move through process, or accepts offers at a lower rate, you can fix the stage causing waste. If post-hire retention falls at 90 days or 1 year, you know the issue sits after hiring, not in sourcing.
What matters most:
- Track each funnel stage, not just hires
- Check selection ratios by group at every step
- Compare offer rate, acceptance rate, and starting pay
- Measure time-in-stage by group to spot process drag
- Link hiring data to 90-day, 6-month, and 1-year retention
- Use structured scorecards and written decision logs, or the data will be weak
You do not need a huge dashboard. You need a small set of numbers reviewed on a fixed cadence, with clear ownership and clean ATS data. That is what turns DEI tracking into something you can use to cut waste, save time, and improve hiring decisions.
How to Benchmark DEI in the Workplace
For more expert insights on optimizing your hiring process, explore our recruitment strategy videos.
sbb-itb-a23bd6a
Core DEI Hiring Metrics to Track Across the Funnel
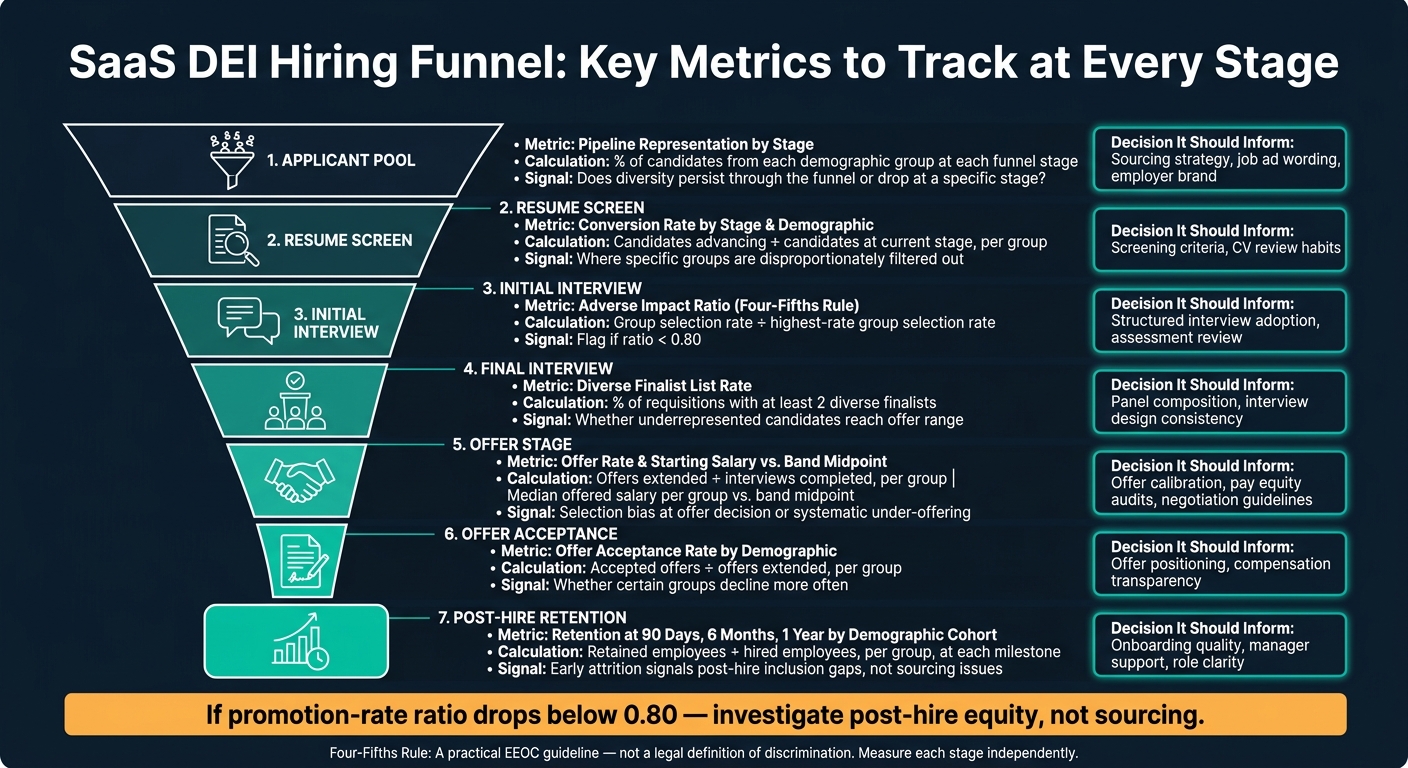
SaaS DEI Hiring Funnel: Key Metrics to Track at Every Stage
Track each stage of the funnel, not just total headcount. That’s how you spot where gaps show up.
Pipeline Representation by Stage
The main question is straightforward: does representation hold as people move through the process, or does it fall away at a certain point?
Applicant pool diversity ratio measures the percentage of applicants from underrepresented groups.[2] If that figure is low, the problem usually starts upstream. In most cases, that points to job ad wording, sourcing channels, or employer brand, not the interview itself.
Stage-by-stage conversion rates by demographic give you the clearest signal. If one group drops hard between application and initial screen, look at your screening criteria or CV review habits, or consider an embedded recruitment service to audit your process. If the drop happens later, the issue is more likely tied to interview design, panel make-up, or inconsistent questioning.[2]
You should also track the share of requisitions with at least two diverse finalists. This diverse finalist list rate has a direct effect on who gets close enough to receive an offer.
Selection Fairness and Adverse Impact Signals
Once you have conversion rates by stage, test whether the gap between groups crosses a threshold that needs attention. The EEOC’s four-fifths rule is a useful starting point: if any group’s selection rate at a stage is below 80% of the highest-rate group’s selection rate, that’s a signal worth checking.[3][5]
The four-fifths rule is a practical guideline, not a legal definition of discrimination.[3][4][5] Measure each stage on its own. If you only look at the overall ratio, you can miss where the problem sits.[6][5]
If selection rates look similar, the gap may be showing up later, in offers or in how long candidates wait to move forward.
Offer Equity and Hiring Speed by Demographic
These metrics show whether equity breaks at the final decision point or after the offer goes out.
Offer rate by demographic , offers extended divided by interviews completed, by group[7] , and offer acceptance rate by demographic , accepted offers divided by offers extended, by group[2][7][9] , help you see whether some groups are being chosen at similar rates but receiving fewer offers, or turning them down more often.
You should also track median offer by group against the band midpoint, along with bonus and equity grants.[2][8][9]
Stage timing by demographic , average days between key stages, split by group , can show whether some candidates are getting pushed back in the queue. What matters is consistency. If one group moves through in 12 days and another takes 20, that points to process friction. And once you can see it, you can fix it.
Use the table below as the standard scorecard for each role family.
| Metric | How It’s Calculated | What It Signals | Decision It Should Inform |
|---|---|---|---|
| Pipeline representation by stage | % of candidates from each demographic group at each funnel stage | Whether diversity persists through the funnel or drops at a specific stage | Sourcing strategy, resume screen criteria |
| Conversion rate by stage and demographic | Candidates advancing ÷ candidates at current stage, per group | Where specific groups are disproportionately filtered out | Screening criteria, interview question design |
| Adverse impact ratio (four-fifths rule) | Group selection rate ÷ highest-rate group selection rate; flag if <0.80 | Potential disparate impact at a specific stage | Structured interview adoption, assessment review |
| Offer rate by demographic | Offers extended ÷ interviews completed, per group | Whether selection bias appears at the offer decision | Offer calibration, hiring manager training |
| Offer acceptance rate by demographic | Accepted offers ÷ offers extended, per group | Whether candidates from certain groups decline more often | Offer positioning, compensation transparency |
| Starting salary vs. band midpoint | Median offered salary per group vs. band midpoint, by level and role | Systematic under-offering to certain groups | Pay equity audits, negotiation guidelines |
| Stage timing by demographic | Average days between key stages, per group | Unequal process speed or recruiter prioritization | Workflow SLAs, recruiter accountability |
How to Measure Inclusion and Candidate Experience During Hiring
Use experience metrics to explain gaps in your funnel. Representation tells you who moves forward. Experience tells you why people stay engaged or drop out. That makes experience data the layer that sits right after funnel conversion.
Candidate Experience Scores by Demographic
Post-interview surveys give you a direct read on whether candidates felt the process was fair and consistent across different groups. Keep the questions simple and useful:
- Did the process feel clear?
- Were you treated with respect?
- Did you hear back within a reasonable timeframe?
Then segment the scores by demographic group. If one group keeps rating clarity or responsiveness lower than others, that can help explain weaker offer acceptance later in the process. In other words, you can spot the cause of drop-off before it shows up in your offer data.
For hiring leaders, that matters because poor experience doesn’t just hurt conversion. It can slow hiring, increase rework, and put pressure on your employer brand.
Structured Interviews and Interviewer Consistency
Standardized scorecards make demographic comparisons worth trusting. If interviewers are using different criteria, you can’t tell whether a conversion gap points to a real difference in fit or just an uneven interview experience.
Track scorecard completion by interviewer. Flag scoring drift when one interviewer rates far above or below the rest without clear reason. If that consistency breaks down, your funnel data stops being dependable.
This is where many teams get stuck. They look at the numbers, but the interview process underneath those numbers isn’t stable enough to support a sound decision.
Qualitative Feedback That Explains the Numbers
Recruiter notes, hiring manager observations, and open-text candidate responses are what turn raw data into something you can act on. Require a written reason for every advance or rejection in your ATS. That gives you an audit trail you can use to spot patterns.
For example:
- Are some groups being rejected with vague reasoning?
- Are drop-outs clustering around one stage or one interviewer?
- Are selection ratios changing after a handoff between recruiter and hiring manager?
Use notes to show where selection ratios shift, not just that they shift. That kind of record also helps keep your hiring data defensible, especially in 2026 as states like Colorado move toward requiring meaningful human review and three-year record retention for all hiring decisions.[10]
Use the table below to connect each experience signal to a hiring outcome.
| Inclusion & Experience Metric | Related Business Outcome | How to Surface It |
|---|---|---|
| Candidate experience score (clarity/respect) | Offer acceptance rate & employer brand | Trend line correlating survey scores with offer declines by demographic |
| Scheduling velocity / SLA adherence | Time-to-fill & candidate drop-off | Funnel stage leakage report showing where delays cause disengagement |
| Scorecard completion & consistency | Quality of hire & defensibility | Heatmap of interviewer calibration against standardized criteria |
| Adverse impact ratio (four-fifths rule) | Compliance & risk mitigation | Red/green status indicator per position flagging selection rates below 80% for any group.[10] |
| Decision rationale quality | Auditability and decision consistency | Word cloud or sentiment analysis of recruiter and manager notes explaining drop-outs |
Connecting DEI Hiring Metrics to Retention, Growth, and Hiring Efficiency
Funnel metrics show who gets hired. What happens next, retention, promotion, and contribution, tells you whether DEI hiring is doing its job. If people join and then leave, stall, or never move into leadership, the hiring story is incomplete.
Representation, Retention, and Promotion Over Time
Use the same demographic splits from your hiring funnel to track who stays and who moves up after hire.
Track retention at 90 days, 6 months, and 1 year by demographic cohort. Watch promotion-rate ratios closely. If a ratio drops below 0.80, that needs attention.
SaaS teams often make progress at entry level, then hit a wall at senior level. That usually points to a post-hire issue, not a sourcing issue. In most cases, the problem sits in onboarding, uneven manager support, or promotion criteria that aren’t applied the same way across teams.
If your pipeline diversity numbers look strong but first-year attrition is higher among underrepresented hires, that’s a post-hire warning sign. Start with the first 90 days. Look at role clarity, onboarding, and manager support. That’s often where the leak starts.
What These Metrics Mean for Revenue and Product Teams
For customer success and sales teams, first-year attrition hits the business fast. It adds backfill costs and cuts pipeline capacity. Strong onboarding and steady manager support often reduce early churn, which means fewer replacement hires and more stable revenue capacity.[12][13]
For engineering and product teams, turnover slows roadmap delivery. It pulls time from managers, delays output, and makes team planning harder. Track promotion rates for underrepresented engineers over 3 to 5 years to see whether entry-level hiring is turning into leadership depth.[1]
Building a Hiring Dashboard Leaders Will Actually Use
Build one monthly or quarterly dashboard that links hiring inputs to retention, promotion, and cost. Keep it short. Leaders tend to act on a tight dashboard with clear trends more than they do on a long compliance report.[2][11]
Pull those post-hire metrics into one view that leaders can review each month.
| Hiring Indicator | Downstream KPI | What to Watch For |
|---|---|---|
| Post-hire representation by cohort | First-year retention | Drop-off after onboarding can signal post-hire inclusion gaps.[2][12] |
| Adverse impact ratio | Promotion velocity | Selection fairness should be matched by equitable advancement.[2] |
| Offer equity / offer acceptance | Cost per hire | Low acceptance rates can increase rework and recruiting spend.[14] |
| Candidate experience score by demographic | First-year retention | Poor experience correlates with early attrition across demographic groups.[14] |
Be clear about ownership. Each VP or function lead should own their team’s row on the dashboard and explain changes quarter over quarter. Embedded recruiters, like those from Rent a Recruiter, can keep data capture consistent and save 80+ hours of internal admin time each month.
Use this dashboard only after the hiring process is standardised.
Next Steps for SaaS Teams in 2026
Standardize the Hiring Process Before Expanding Your Metric Set
Once your dashboard is set, the next job is simple: make the process measurable.
Before you add more DEI metrics, get the hiring process into a set structure. Put a job scorecard in place. Use a stage-based rubric. Create an interview guide. Keep a decision log. Role-specific scorecards help keep evaluations tied to the actual job, not gut feel or personal bias.
This matters for one reason: bad process creates bad data.
When every recruiter and hiring manager records the same reason for candidate movement, your data becomes far more useful. Funnel representation, fairness checks, offer equity, and retention outcomes are then solid enough to guide hiring decisions, budget choices, and team planning.
Use Embedded Recruitment Support to Improve Data Quality and Visibility
When hiring demand jumps, internal teams often lose consistency across sourcing, interviews, and reporting.
That’s usually where things start to slip. ATS data gets patchy. Feedback comes in late, or not at all. Reporting by stage becomes harder to trust. And when the data is messy, leaders lose sight of what’s working and what’s costing time and money.
If your team can’t keep that consistency on its own, Rent a Recruiter can step in with embedded recruitment support. Their recruiters work inside your team to keep ATS usage, structured feedback, and stage-by-stage reporting consistent. That helps clients cut hiring costs by up to 70% while saving over 80 hours per month in internal admin time.
Conclusion: Track Fewer Metrics, Use Them Better
With cleaner process data in place, you can make decisions with more confidence.
Track fewer metrics, but review them on a fixed cadence and give each one a clear owner. Fix the process first. Tighten data capture next. Add support where hiring starts to break. That’s what turns DEI metrics from a reporting task into something you can use to improve hiring outcomes and retention.
If you want help scaling without losing control of hiring quality, consider Rent a Recruiter and its Recruitment Health Check to spot where your process is breaking down.
FAQs
Which DEI metrics matter most first?
Start with three metrics:
- demographic data at the application stage
- interview progression rates, including the Diversity Interview Ratio
- Diversity Hiring Rate
Track each stage so you can see where underrepresented candidates drop out and act on the data.
For hiring leaders, this matters because you can’t fix what you can’t see. If diverse applicants enter the funnel but don’t reach final interview or offer stage, you’ve got a process issue, not a pipeline issue.
That gives you a clearer way to act:
- fix screening criteria
- review interviewer consistency
- tighten scorecards and decision points
Done well, this leads to better hiring outcomes, less wasted time, and more control over your process.
How often should we review DEI hiring data?
Conduct formal audits of AI-driven hiring tools annually to help keep them compliant and reduce bias risk.
Beyond that, track hiring outcomes at each stage of the process, resume reviews, interviews, assessments, and offers, so you can spot gaps early. If a protected group’s selection rate falls below the four-fifths rule threshold, review that data straight away.
For hiring leaders, this is not just about policy. It’s about risk control, hiring quality, and cost. Catching issues early can help you avoid poor hiring decisions, legal exposure, and wasted time across the team.
What should we do if one group drops off more?
If one group drops off more often than another, track each hiring stage to see where things are getting stuck. Use the four-fifths rule: if a protected group’s selection rate falls below 80% of the highest group’s rate, that’s a sign to dig into the process.
Look closely at screening, interview scoring, and offer competitiveness. A weak point in any one of these can hurt hiring outcomes, slow decisions, and increase the cost of missed hires.
To keep the process focused on merit and cut subjective bias, use:
- Structured interviews
- Competency-based rubrics
- Independent scoring
That gives you a more consistent way to assess people, and better visibility into where your hiring process may be falling short.