If you are planning growth without a clean retention rate, you are guessing your hiring budget.
I would calculate employee retention rate with one simple formula: employees from the starting group who are still employed at the end of the period ÷ employees in that starting group × 100. That number helps you estimate backfill demand, recruiter workload, and hiring spend before exits start hitting delivery.
In plain terms, this article shows you how to:
- pick one time period and stick to it
- use a fixed starting cohort
- exclude new hires from the retention count
- avoid bad data pulls from mixed systems or dates
- use the result to plan hiring volume and cost
A short example makes the point fast. If you start the year with 80 employees and 68 of them are still with you on 12/31, your retention rate is 85%. If your growth plan needs 30 net new hires, you may not be hiring 30 people in total. You may be hiring 42 when backfills are added.
That is why retention is not just an HR metric. It is a hiring planning number. Read on if you want a clean way to calculate it and use it to keep headcount plans, time, and spend under control.
How to Calculate Employee Retention Rate: Step-by-Step Formula
How To Calculate Employee Retention Rate
sbb-itb-a23bd6a
1. What Employee Retention Rate Measures and Why SMEs Track It
Employee retention rate looks at the same group of employees at the start and end of a set period.
The cleanest way to measure it is with a cohort-based method. Your starting group is the denominator. The people from that same group who are still employed at the end of the period are the numerator.
That sounds simple. In practice, it goes wrong fast if you don’t set the rules first.
Before you calculate anything, define:
- the time period
- the employee group
- the inclusion rules
Two choices change the result more than anything else. First, whether approved leave counts as retained. Second, whether contractors and temporary staff are excluded. If those rules aren’t locked in upfront, two people in the same company can pull from the same payroll data and still report different retention rates.
For HR leaders, this metric shows whether pay, management, and growth paths are strong enough to keep people. For CFOs, it puts a number on the cost of exits, including recruiting fees, lost output, and repeated onboarding spend. For founders, it shows whether the team is stable enough to deliver growth plans without having to refill the same roles again and again.
Retention Rate vs. Turnover Rate
Retention and turnover are linked, but they are not the same metric.
Retention tells you who stayed from your starting group. Turnover tells you who left during the period, usually measured against average headcount. Because the denominators are different, one metric does not neatly reverse the other.
That matters more than it might seem. An SME can show moderate turnover and still post strong retention in its key roles if most exits come from short-tenure or non-core positions.
| Metric | What It Measures | Denominator Used |
|---|---|---|
| Retention rate | Share of starting employees who stayed | Starting headcount (cohort) |
| Turnover rate | Share of employees who left during the period | Average headcount during the period |
Track both. Just don’t ask them to do the same job.
Use retention when you want to know how well you kept a defined employee group. Use turnover when you want to know how much exit volume the business carried over the period. Once that distinction is clear, the next move is picking the right formula and measurement window.
How Retention Affects Hiring Cost and Growth Plans
Every backfill sets off a chain reaction.
You need to write job descriptions, review applicants, run interviews, and onboard the new hire. That takes time, and it pulls managers away from customers, delivery, and planning.
For scaling SMEs, the numbers stack up fast. Say you have 100 employees and your annual retention rate is 85%. That points to about 15 exits over the next 12 months. If your growth plan calls for 30 net new hires, you’re not planning for 30 hires in total. You’re planning for 45 hires.
That’s a very different budget.
It changes recruiter capacity, hiring timelines, manager workload, and cash flow planning. It can also expose whether your internal hiring setup can handle demand, or whether you’ll end up leaning on multiple recruitment agencies at the worst time.
Higher retention cuts the backfill load. That lowers recruiting spend, reduces repeated onboarding costs, and makes headcount planning far more dependable. For a scaling company, this is not a small admin win. It’s the line between a hiring plan that stays on track and one that starts slipping halfway through the year.
2. Choose the Right Formula and Measurement Period
The Standard Retention Rate Formula
Once you’ve defined the cohort, use one fixed formula every time:
Retention Rate (%) = (employees from the starting cohort still employed at the end of the period ÷ employees at the start of the period) × 100 [1]
That consistency matters. If you switch the formula between monthly, quarterly, and annual reports, your numbers stop being useful. Like-for-like reporting gives you a cleaner view of attrition, team stability, and where hiring pressure may build.
Define the Period and Employee Group
Monthly reporting gives you fast feedback. Quarterly reporting is often a sensible middle ground for SMEs. Annual reporting can help with year-end review and budget planning.
Whatever period you choose, fix the cohort before you report: employees employed on the first day of the period. Exclude hires who join later from both the numerator and denominator. Use the same rules across each team so results stay comparable.
That way, when retention shifts, you can spot whether the issue sits in one function, one manager group, or the business more broadly. Once the cohort and period are fixed, you can work through the calculation step by step.
3. How to Calculate Employee Retention Rate, Step by Step
Once your formula and measurement period are set, the calculation itself is pretty simple. The key is to stay consistent. If your dates or data sources shift, your retention rate can drift too.
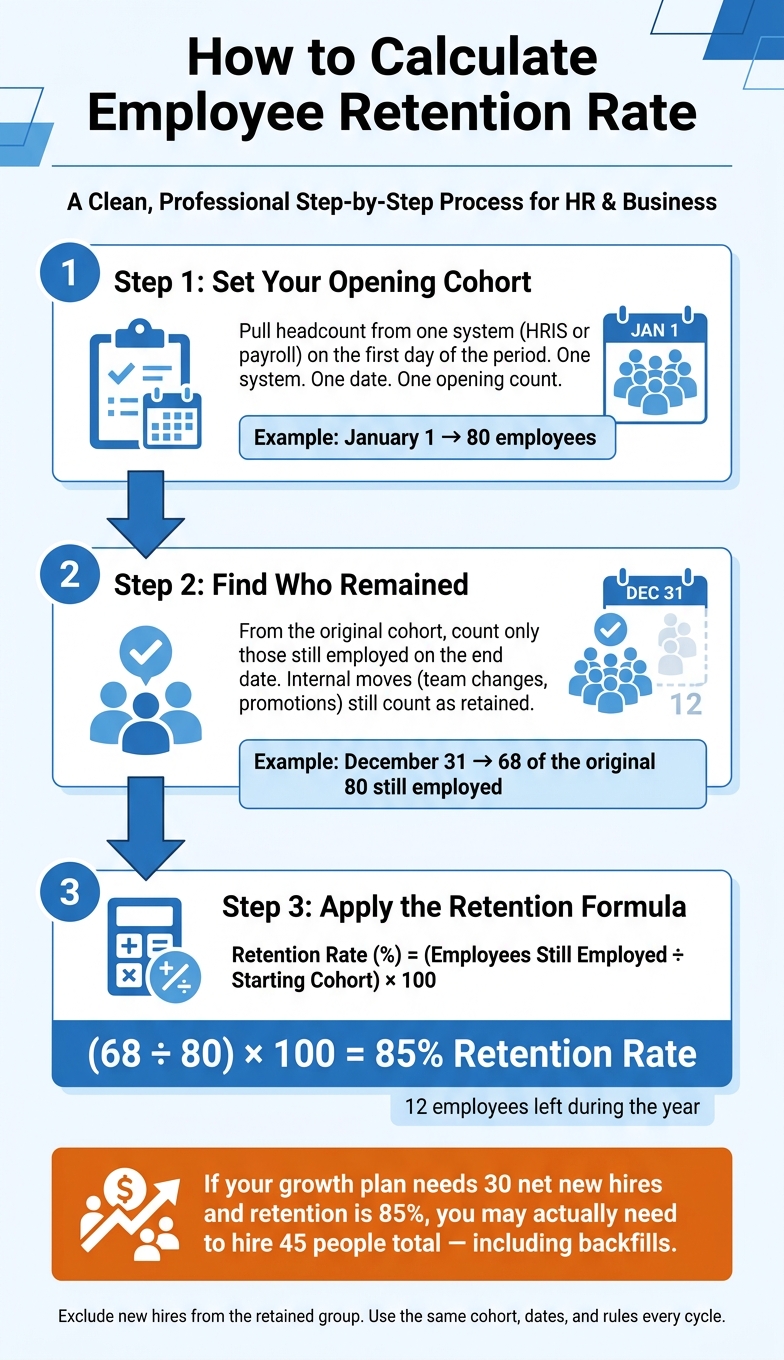
Step 1: Count Employees at the Start Date
Start with the opening cohort from your formula. Pull headcount from one source, usually your HRIS or payroll system, on the first day of the period.
If you’re measuring a calendar year, use January 1 and December 31. Count each active employee on the start date once.
Mixing systems, or pulling data from slightly different dates, can throw off the result. One system. One date. One opening count.
Step 2: Identify Who Stayed Through the End Date
Next, go back to that same starting cohort and check who was still employed on the end date.
This is your numerator. You’re not counting everyone employed at year-end. You’re counting only the people from the original group who stayed.
Internal moves still count as retained. If someone changed teams, locations, or titles but stayed with the business, they remain in the retained group. You’re measuring who left the company, not who changed roles.
Step 3: Apply the Formula With a Simple SME Example
Say you run an 80-person company. On January 1, you had 80 employees on payroll. By December 31, 68 of those original employees were still with the company.
Using the standard formula:
(68 ÷ 80) × 100 = 85.0% retention rate
That means 12 employees left during the year.
Once you have the headline number, break it down further. This is where the metric starts to help with decisions, not just reporting.
You can segment retention by:
- Team
- Location
- Manager
- Tenure
That helps you spot where turnover is hitting hardest, where management issues may sit, and where hiring plans may need a reset.
Once you have the number, check the mistakes that can distort it.
4. Common Mistakes That Change the Result
Once the formula is fixed, the main problems usually come from the inputs. Small data mistakes can distort the number fast. And if the number is off, your hiring plan can be off too.
Counting New Hires in the Retained Group
Don’t count new hires in the retained group. Retention should only measure the people who were in the business at the start of the period.[2][3]
Here’s a simple example. Say you start the year with 40 employees, lose 10, and hire 15 new people. Your ending headcount is 45. But that does not mean retention is based on 45.
The right calculation looks only at the original 40 employees. If 30 of those 40 are still with you at the end of the year, retention is 75% (30 ÷ 40 × 100). If you divide 45 by 40, you get 112.5%, which overstates the rate.[2][3]
The fix is straightforward:
- Take a snapshot of active employees on the exact start date
- Tag each employee record with a hire date
- Filter the retained group to include only employees hired on or before that date
- Track new hires separately so retention stays cohort-based
Then do one more check. Make sure your start and end counts come from the same system.
Using Mismatched Dates or Systems
This one catches teams out all the time. If your start headcount comes from payroll but your end-of-period status comes from your HRIS, the result can shift before the reporting period has even properly started.
For example, a payroll file dated January 1 and an HRIS export dated January 3 may already include one or two new hires. That changes the starting cohort and gives you a different retention figure.[4][5]
In a smaller company, even a gap that looks minor can move the percentage enough to affect planning. Use one system for both the start and end counts. Use one system and one cutoff date.[5]
Changing Inclusion Rules Mid-Report
Retention trends only work if the population stays the same.
If Q1 includes only full-time permanent employees, but Q2 also includes part-time staff and contractors without calling out the change, the trend line stops being useful. At that point, the shift in the rate may say more about your reporting method than about whether people are staying.[4]
Keep your inclusion rules the same across each period. If the method changes, document it clearly in the report.[4]
| Common mistake | What it distorts | Simple fix |
|---|---|---|
| Counting new hires as retained | Inflates retention rate, sometimes above 100% | Filter retained group to the starting cohort only |
| Mismatched dates or systems | Makes the result hard to reproduce | Use one system and one fixed reference date |
| Changing inclusion rules mid-report | Makes trends unreliable | Document rules and apply them consistently |
Once the count is clean, you can start reading the number properly and use it to shape hiring plans.
5. How to Read the Result and Apply It to Hiring Planning
Once you have a clean retention rate, use it to guide hiring decisions.
What a High or Low Retention Rate Can Signal
Use the result to spot where retention is holding up and where it starts to slip. A company-wide rate only tells part of the story. You need to break it down by team, manager, and tenure.
A steady company-wide rate can still hide a team leader losing half their team. And that matters. Those patterns give you an early view of where backfills are most likely to hit next, so you can plan before the pressure lands on your hiring team.
How Retention Data Improves Hiring Forecasts
Retention trends help you forecast backfill hiring before roles even open. If one team keeps losing people in their first year, you can expect more replacement hiring there and line up recruiter capacity earlier.
First-year turnover is one of the clearest signals to watch because it points to the replacement rate of new hiring cohorts and future recruiter workload. [1] If unplanned absences rise above 5%, treat that as an early sign that turnover may climb in the next 3 to 6 months. [1]
That shifts retention tracking from a simple HR report into a hiring planning tool with direct impact on workload, budget, and delivery.
Using Retention Metrics to Build a Scalable Hiring Function
Consistent retention tracking moves hiring from reactive to planned. It also shows how much growth you can support through internal promotions versus external hiring. High-maturity organisations target a 25% to 30% internal mobility rate. [1]
For high-growth SMEs facing fast hiring demand, embedded recruitment support can help turn retention data into a more predictable hiring plan.
6. Conclusion: Standardize the Metric and Act on What It Shows
Once you can read the result, the next step is to standardise how you track it. Retention tracking only works if you use the same cohort, dates, and rules every cycle. Standardise offboarding codes so each exit is recorded the same way. Use one clear exit definition so your trend data stays comparable.
Once the number is reliable, it becomes a practical hiring tool. It helps you see where turnover is creating a gap, which teams may need support, and when it makes sense to add recruitment capacity.
When retention patterns start putting pressure on hiring capacity, outside support can make a big difference. If your retention data shows a hiring gap, Rent a Recruiter can embed experienced recruiters into your team to help you scale hiring faster and cut admin load.
FAQs
Should employees on leave count as retained?
Yes. Employees on leave should generally be counted as retained because they still work for the organisation.
If they are still on payroll and their employment has not officially ended, they count as active staff in retention rate calculations. Only voluntary exits and involuntary terminations should be left out.
What’s the best period to track retention?
Use a consistent schedule that tracks both short-term issues and longer-term patterns. 90-day retention is the clearest way to spot hiring or onboarding problems early, while 12-month retention gives you a better view of employee success over time and the health of your organisation.
For reporting, review efficiency metrics monthly and retention quarterly. That gives you enough frequency to catch issues before they turn into bigger hiring costs, without overreacting to week-by-week noise.
Looking at results across back-to-back quarters also helps you see what’s changing. If retention improves quarter after quarter, your hiring and onboarding changes are likely working. If it doesn’t, you know where to dig in. That kind of visibility matters when you’re trying to cut wasted spend, save leadership time, and improve hiring outcomes.
How do I use retention rate for hiring forecasts?
Use retention rates to shift from reactive backfilling to a proactive rolling 12-month headcount plan.
Start by reviewing past attrition by department and job level. That helps you spot patterns early, like seasonal spikes or higher turnover in the first year of hire.
Once you know where exits are most likely, build those expected turnover rates into your plan. That gives you time to line up talent pipelines, keep hiring capacity in place, and cut down on rushed backfills.
For CEOs, CFOs, and HR leaders, this matters for one simple reason: surprise hiring is expensive. Better forecasting means less disruption, lower agency spend, and more control over hiring outcomes.