If you cannot see your cost per hire by role, source, and team, you cannot control recruitment spend.
I’d treat this as a simple finance exercise, not an HR reporting task. Set one time period, pull in internal time and external fees, total the spend, then divide by actual starts. That gives you a number you can use to cut waste, reset channel spend, and stop agency costs from eating into growth plans.
For many scaling companies, that means looking hard at:
- Internal hiring time that never hits the recruitment budget
- Agency fees that can run at 15% to 25% of salary
- Tool costs, ads, travel, relocation, and sign-on bonuses
- Cost per hire by function, seniority, and source
- Savings levers such as tighter interview stages and lower agency use
A clear review like this helps you make better budget calls in SaaS, Technology, IT, Fintech, Engineering, Security, Insurance, and Professional Services. If you want more control than traditional recruitment agencies tend to give, Rent a Recruiter and other embedded recruitment providers can help move spend onto a fixed monthly model and cut cost per hire.
Here’s the short version of what I’d take from the article.
What matters most:
- Use one reporting window only. Monthly, quarterly, or annual is fine. Mixing time periods gives you a bad number.
- Count all internal labour. Recruiters, hiring managers, panel time, admin support, and tools all belong in recruitment spend.
- Tag every external cost to the role. If agency invoices, ads, and travel sit in different systems, your numbers will be off.
- Use starts, not offers. Otherwise your cost per hire looks lower than it is.
- Split the result. One blended average hides where money is being lost.
If your biggest issue is agency reliance, this is often where the largest savings sit. Many scaling firms move part of that spend into embedded recruitment so they get more visibility, lower admin load, and stronger control over hiring output.
If you want to pressure-test the numbers before changing your model, a recruitment ROI calculator can help you compare internal cost, agency spend, and fixed-cost support side by side.
Below is the article’s core message, condensed into one clear view.
| Step | What you review | Business impact |
|---|---|---|
| 1 | Time period and hiring scope | Stops bad reporting and weak budget decisions |
| 2 | Internal labour, tools, referrals, admin | Shows hidden spend per hire |
| 3 | Agencies, ads, vendors, travel, relocation, sign-ons | Brings outside costs into one view |
| 4 | Total recruitment spend | Shows if hiring plan and budget still line up |
| 5 | Cost per hire by team, level, and source | Shows where to cut spend first |
The main point is simple: recruitment cost analysis only works if every hiring cost is pulled into one model and tied back to actual hires. Once you do that, the waste usually becomes easy to spot.
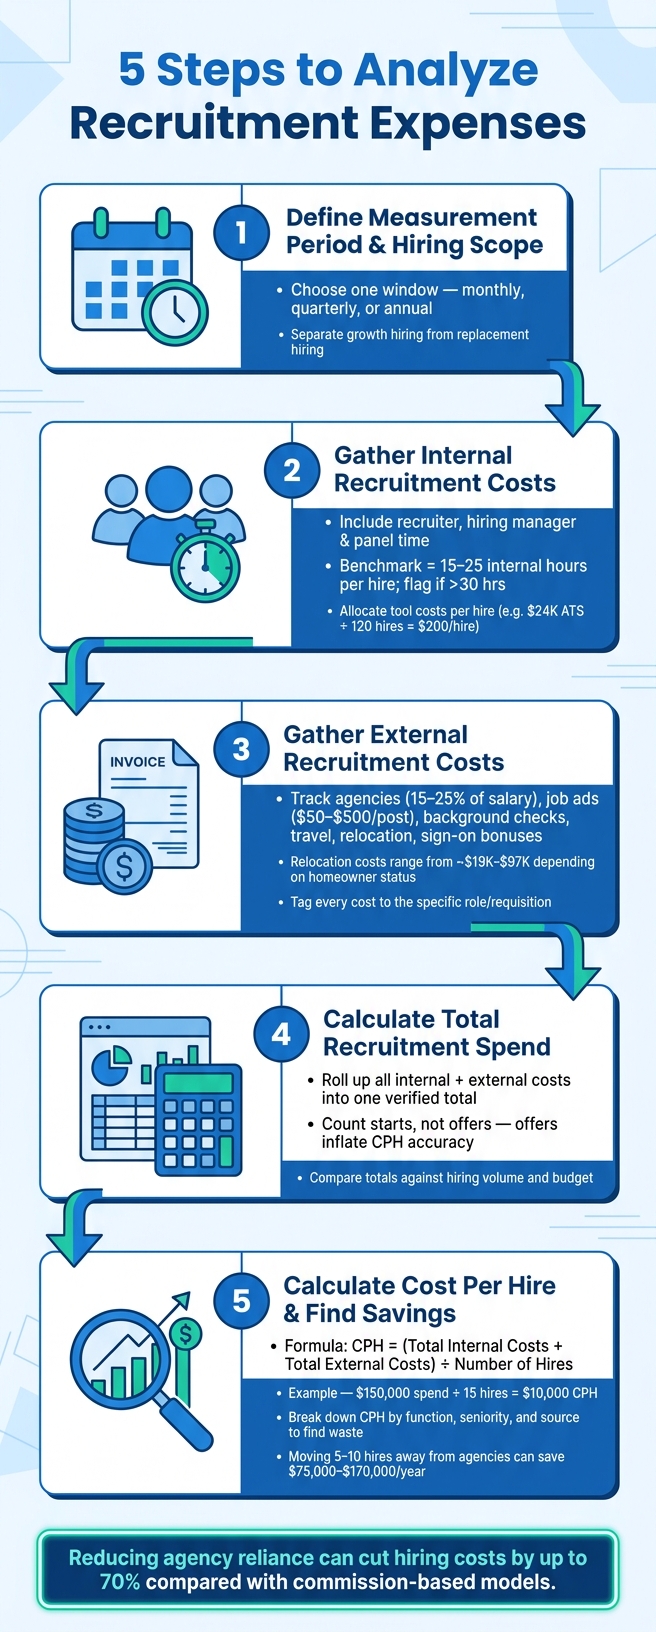
5 Steps to Analyze Recruitment Expenses
Cost Per Hire: How to optimize recruitment costs & strategy
sbb-itb-a23bd6a
Step 1: Define your measurement period and hiring scope
Start by choosing one reporting window for this review, then stick to it for every cost and every hire. Use a month, a quarter, or the last 12 months. If you mix time frames, the maths falls apart fast. Annual spend divided by monthly hires might look precise on paper, but it gives you a number you can’t use.[1]
Choose one reporting window for spend and hires
The best window depends on how often you hire.
If your team is hiring at volume, monthly reporting can help you spot cost spikes early. Quarterly reporting is often the best fit for many businesses. It gives you enough hiring activity to work out a useful cost per hire, without waiting a full year. A 12-month view makes more sense for board discussions or annual budget planning.
Be explicit. Write down the period in black and white, such as Q2 2026 or January 1, 2026 to June 30, 2026.
Then make one more choice: are you measuring actual spend, projected spend, or budgeted spend? Pick one view and use it all the way through. If you blend them, your numbers stop being decision-ready.
Once the window is fixed, narrow the scope.
Limit the scope to active hiring costs
Now define what sits inside the review. That could be specific roles, business units, or regions. A tight scope makes the result easier to act on. If the input is messy, the output will be too.
Separate growth hiring from replacement hiring. If you don’t, churn can distort your cost per hire and make team expansion look more expensive than it is.
Next, gather the internal costs tied to that scope.
Step 2: Gather your internal recruitment costs
A lot of companies track agency invoices down to the cent, but internal hiring time often gets lumped into overhead and ignored. That’s a mistake.
Internal hiring time is a direct recruitment cost. If your recruiters, hiring managers, and interview panel spend hours on a role, that time has a dollar value. And when hiring volume picks up, those costs stack up fast.
Add recruiter, hiring manager, and interview time
Every person involved in a hire adds cost through their time. That includes recruiters, hiring managers, panelists, HR business partners, and coordinators.
Use each person’s fully loaded hourly cost:
salary + bonus/commission + benefits + payroll taxes + overhead, divided by 2,080 hours.
Here’s what that looks like in practice. At a $180,000 fully loaded annual cost, a hiring manager costs about $86.50 per hour. Seven hours of hiring time comes to $605.50.[2][6]
That might not sound huge on its own. But multiply it across every open role in a quarter and the total climbs quickly.
A useful benchmark for mid-level professional roles is 15 to 25 total internal hours per hire across recruiter, hiring manager, and panel time combined. If roles are running well above 30 hours, your process may need tightening.[2][4]
Include internal tools, referrals, and admin overhead
Time is only one part of the picture. Your internal hiring cost also includes the tools and admin work that keep the process moving.
Include costs such as:
- ATS licences
- LinkedIn Recruiter
- Scheduling software
- Video interview platforms
- Assessments
Allocate each tool’s annual cost across your expected annual hires. For example, a $24,000 per year ATS spread across 120 planned hires works out to $200 per hire in tool cost.[3][6]
You should also log referral bonuses and recruiting admin time per hire.
Once you’ve logged your internal costs, the next step is to map external fees and candidate expenses.
Step 3: Gather your external recruitment costs
After internal hiring time, the next job is to pull in the outside costs tied to each hire. This is where teams often miss spend, not because it is small, but because it sits in different places across AP, HR, payroll, and procurement.
If you want a clean cost-per-hire number, every external cost needs to be tied back to a specific role.
Track agencies, job ads, and hiring vendors
External recruitment costs cover vendor fees and candidate-related spend linked directly to hiring. That usually includes agency and search fees, job board postings, paid social recruiting ads, background checks, skills tests, and vendor-run screening tools, career fairs and recruiting events, and employer branding vendors.
Agency fees are often the biggest outside cost, especially for senior hires or roles that are tough to fill. In the U.S., contingency agencies usually charge 15% to 25% of first-year salary, while retained search firms tend to charge 25% to 33%.[8][9][10] On a $120,000 salary, a 20% contingency fee comes to $24,000.
That adds up fast.
Job board costs are lower, but they still matter. Posting fees usually sit between $50 and $500 per posting, depending on the platform and the level of the role.[5] Track each post by role, not just by platform, so you can see later which channels are worth the spend and which ones are just burning budget.
You also need to reconcile these costs across systems. Agency invoices may sit in AP. Travel reimbursements may live in expense software. Bonus payments may come through payroll. Tag every line item to the requisition so Step 4 can roll up the full hiring cost by role, department, and channel.
Capture candidate travel, relocation, and signing costs
These costs are easy to miss because they often sit outside the HR budget. They still belong in recruitment spend.
Include interview travel, relocation stipends, temporary housing, and moving allowances. One employer guide puts average U.S. relocation packages at roughly $19,309 to $24,216 for renters and $72,627 to $97,116 for homeowners.[11] For senior hires or roles tied to a certain location, those numbers can swing your cost per hire in a big way.
Sign-on bonuses should also be logged on their own. They are a one-time hiring cost, not part of ongoing pay, and folding them into a broad offer-cost bucket makes it harder to see what you are spending to close hires in tight markets.[11] Record them by role and department so patterns start to show up.
If signing bonuses keep showing up in the same teams, that is not random. It often points to a pay-positioning issue, a slow hiring process, or a market where demand is outpacing your offer.
This keeps each cost tied to the hire instead of getting lost in general spend.
| External Cost Category | What to Include | Where It Often Hides |
|---|---|---|
| Agency & search fees | Contingency and retained fees | Accounts payable |
| Job advertising | Job board posts, paid social ads | Marketing or HR budgets |
| Background checks & screening | Skills tests, vendor-run screening tools | Software or vendor subscriptions |
| Candidate travel | Flights, hotels, ground transport | General travel and expense |
| Relocation | Stipends, moving allowances, temporary housing | Compensation or HR budgets |
| Sign-on bonuses | One-time offer incentives | Payroll or compensation |
Once each cost is tagged by role and department, roll those numbers into total recruitment spend in Step 4.
Step 4: Calculate your total recruitment spend
Now bring your internal and external hiring costs into one verified total for the reporting period. If you’ve tagged each cost properly, this part should be pretty straightforward.
Roll up costs by category and role
Pull all tagged line items into a single tracker or spreadsheet. Then group spend by category, department, and role type.
Use a summary like this:
| Cost Category | Internal/External | Total Spend (USD) | Related Role/Department |
|---|---|---|---|
| Internal Labor | Internal | $85,000.00 | Engineering, ICs & Managers |
| Technology (ATS) | Internal | $12,500.00 | All departments |
| Agency Fees | External | $60,000.00 | Sales, Enterprise AE |
| Advertising/Job Ads | External | $18,000.00 | Customer Support, Marketing |
| Candidate Expenses | External | $9,500.00 | Executive roles, all functions |
This gives you a clean view of where hiring spend is going and which teams are driving it.
Once you’ve rolled everything up, pressure-test the numbers against the hiring plan.
Check totals against hiring volume and budget
Compare total spend against completed hires and budget. That’s how you see whether hiring costs are landing where you expected, or drifting off course.
If you planned 30 hires at $6,000 each but hired 35 at $7,500 each, you overspent by $52,500, even though you still hit headcount.[7][12] That’s the kind of gap a CFO or Talent Leader will want explained before it turns into a repeat issue.
One more point matters here: count starts, not offers. If you count offers instead of starts, cost per hire looks lower than it is.[7][13]
Once total spend is confirmed, you’re ready to calculate cost per hire and spot the biggest savings levers.
Step 5: Calculate cost per hire and find savings opportunities
Calculate cost per hire, or CPH, with this formula: CPH = (Total Internal Costs + Total External Costs) ÷ Number of Hires in the Period.[7][12][14]
Here’s a simple example. If your company spent $150,000 on recruitment in Q1 2026 and made 15 hires, your average CPH is $10,000. That gives you a baseline, but the average on its own only tells part of the story.
To make it useful, compare CPH by department, seniority, and source. Then split the result again by function, seniority, and source. That’s where waste starts to show up.
Break down cost per hire by function, seniority, and source
Engineering hires, agency-sourced hires, and senior roles often cost more. Once you split CPH by function and source, the average stops being a headline number and starts becoming something you can act on.
Use a simple role-by-role breakdown like this:
| Hiring Function / Source | Number of Hires | Total Spend (USD) | Cost Per Hire (USD) |
|---|---|---|---|
| Engineering – Agency | 3 | $72,000 | $24,000 |
| Engineering – Direct | 2 | $18,000 | $9,000 |
| Sales – Referrals | 3 | $15,000 | $5,000 |
| Sales – Job Boards | 3 | $33,000 | $11,000 |
| Operations – Direct | 4 | $12,000 | $3,000 |
The pattern is usually easy to spot. Engineering agency hires cost far more than direct-sourced hires, while referrals often come in below job boards on cost. Senior and executive hires also tend to cost 2 to 4 times more than junior hires because they need more sourcing, more interviews, and higher external fees.[14][15]
This matters for one reason: you can’t cut hiring costs if all roles are lumped into one average.
Act on the fastest savings levers
The fastest place to start is agency use. Set clear rules: use agencies only for hard-to-fill roles, and move the rest to direct sourcing or referrals.
The next win is usually to rate your recruitment process and optimize your interview stages. If your team is running extra rounds that don’t change decisions, cut them. Fewer redundant interviews means less hiring manager time spent, lower internal cost, and often a shorter time-to-hire as well.
You also need clean source tracking in your ATS. If source data is messy, you’re flying blind. You won’t know which channels are earning their keep and which ones are draining budget.
Once the highest-cost channels are clear, cut or cap those first. This is where Rent a Recruiter can help. Rent a Recruiter places experienced recruiters inside your team, giving you more structure, visibility, and control while helping scaling companies cut hiring costs and admin time. Moving even 5 to 10 annual hires away from agencies can save $75,000 to $170,000.[14][15]
Track these levers each quarter so you can see where CPH starts falling first. Then use that data to reset hiring budgets and channel rules for the next cycle.
Conclusion: Make recruitment cost analysis a regular habit
Once you’ve mapped your spend and savings, don’t leave the exercise sitting in a folder. Turn it into a repeatable review so hiring spend stays visible, measurable, and under control.
Review monthly if you’re hiring at volume, and quarterly for most teams. For that to work, one person needs to own it. Give one owner responsibility for pulling the numbers, checking them, and reporting them each cycle. If nobody owns it, the analysis turns into a one-time exercise instead of a useful input for hiring and budget decisions. For more insights on optimizing your talent strategy, explore The Talent Fix Recruitment Blog.
Your first review gives you a baseline. From there, set a 6 to 12 month target based on your biggest cost driver. If agency spend is the issue, that’s where the biggest savings often sit. Teams that reduce agency reliance can cut hiring costs hard without slowing hiring or lowering the bar. Companies that place experienced recruiters directly into their hiring function, like those working with Rent a Recruiter, can reduce hiring costs by up to 70% compared with commission-based models.
Use each review to make practical changes:
- Adjust your channel mix
- Renegotiate vendor terms
- Put savings back into employer branding and retention
Run the next review using your most recent completed quarter.
FAQs
What counts as internal hiring cost?
Internal hiring costs cover the resources your company puts into recruitment in-house.
That includes recruiter and HR salaries and benefits, plus the prorated time your hiring managers and team members spend on interviews, CV reviews, and admin.
It also covers recruitment software and ATS subscriptions, employee referral bonuses, and internal training or mobility programmes.
When you add it all up, the cost is often higher than it looks at first glance. You’re not just paying for talent acquisition headcount. You’re also paying for time pulled away from revenue-driving work, team coordination, and the systems needed to keep hiring moving.
Should I use starts or offers?
Use offers only if you also track your offer acceptance rate.
That number shows how competitive your pay package is, and how well your hiring process lands with candidates. If acceptance is low, the issue may be the offer itself, or the time it takes your team to get it out.
This matters because a weak acceptance rate drives up hiring costs, adds delays, and puts more pressure on your team to restart searches. By tracking both metrics together, you can spot where your process is off and make data-led changes that improve hiring outcomes.
How often should I review recruitment spend?
Review your recruitment spend quarterly.
Monthly figures can swing too much to give you a clear read. Annual reviews often come too late, by then you’ve already carried wasted spend for months.
A quarterly check gives you a better view of what’s working, what’s draining budget, and where hiring costs are starting to creep up.
Done well, these reviews help you:
- spot patterns in spend and hiring output
- cut waste from low-performing channels
- move budget toward the sources that deliver better hires
For CEOs, CFOs, and talent leaders, that means better cost control, less wasted spend, and sharper hiring decisions.