If you are scaling and your roles stay open too long, you are losing money every week.
I’d boil this article down to a simple point: track hiring speed, cost, funnel conversion, hire quality, and recruiter capacity by role type, then use those numbers to fix delays before they hit revenue, delivery, or team output. For U.S.-based SMEs, non-executive roles average about 44 days to fill, non-executive cost per hire averages $5,475, and offer acceptance often sits around 75%, with stronger teams reaching 85% to 95%.
Here’s what matters most if you run hiring in SaaS, Technology, IT, Fintech, Engineering, Security, Insurance, or Professional Services:
- Time to hire shows how fast you move once a candidate enters process
- Time to fill shows the full delay, including approvals and internal hold-ups
- Cost per hire often looks low until you include vacancy cost and manager time
- Funnel conversion shows where candidates drop out
- Quality of hire shows whether fast hiring is producing hires that stay and perform
- Recruiter output shows whether your team has enough capacity
A few benchmark figures stand out:
- Sales roles often close in 25 to 35 days
- Software engineering often takes 40 to 50 days
- Product roles often take 45 to 60 days
- Data and ML roles often take 55 to 70 days
- Offer acceptance below 75% often points to process issues, not just pay
- Final interview to offer delays beyond 72 hours can hurt acceptance rates
- Recruiter capacity often sits around 8 to 15 hires per recruiter per quarter
If your numbers are off, the issue is usually not just sourcing. It is often approval drag, weak interviewer alignment, slow feedback, or not enough recruiter capacity. That is where embedded recruitment can help, especially when you need more hiring output without building a full internal team straight away.
Below, I’ll walk through the benchmarks that matter and what they mean for cost control, hiring pace, and scale.
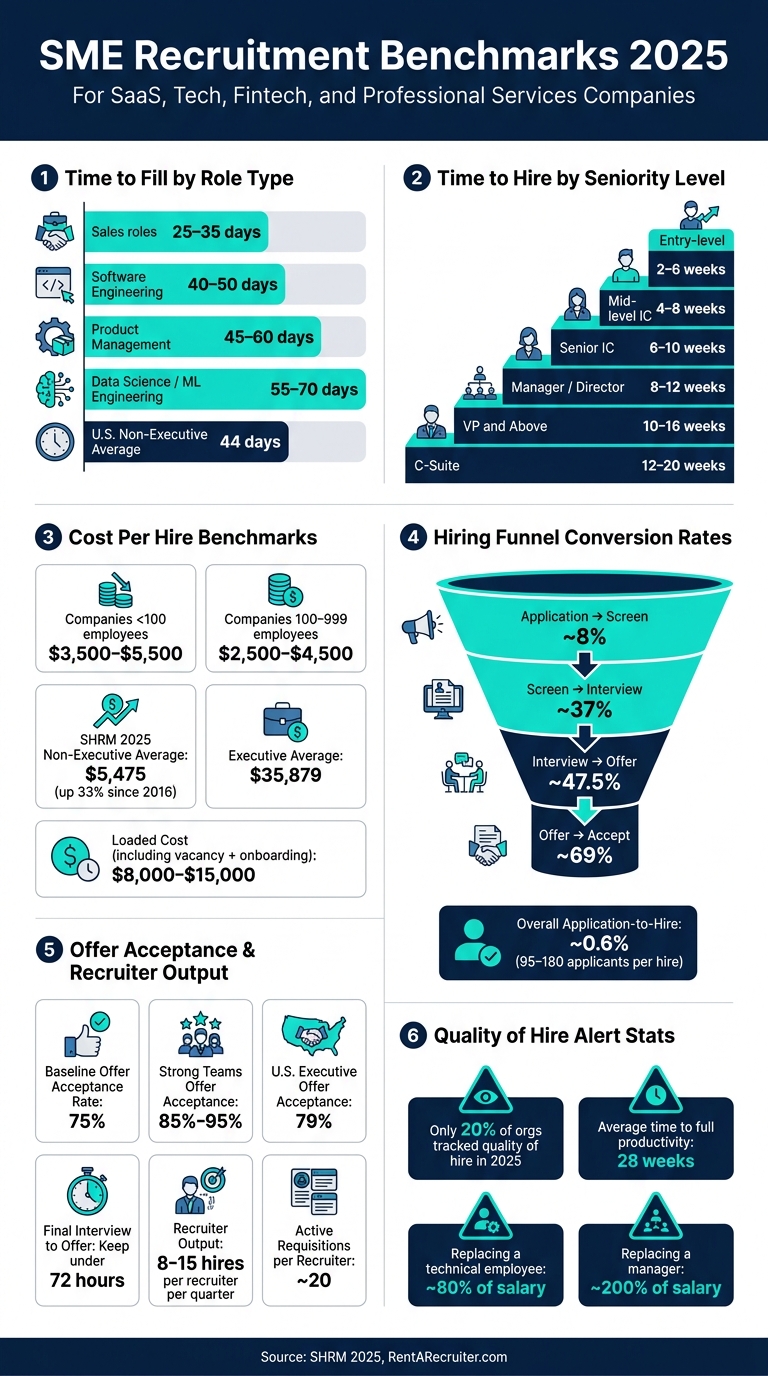
SME Recruitment Benchmarks 2025: Key Hiring Metrics at a Glance
The Ultimate Guide to Talent Acquisition KPIs (Cost, Quality, Speed & More)
sbb-itb-a23bd6a
Main efficiency benchmarks: time and cost per hire
The benchmarks that matter most are time to hire, time to fill, and cost per hire. Together, they show how long a role stays open, what it costs to close, and whether your hiring plan fits the stage your business is in.
If you’re scaling in SaaS, Technology, Fintech, Engineering, or Professional Services, these numbers do more than track recruitment. They shape headcount planning, budget control, and delivery speed.
Time to hire and time to fill by role
Start with the two metrics that explain most hiring drag.
These terms get mixed up all the time. Time to hire measures the days from when a candidate enters your pipeline to when they accept an offer. Time to fill measures from job req approval to that same accepted offer, so it includes internal delays as well as recruiter pace. The gap between the two tells you where the business is slowing hiring down.
That gap matters. If time to hire looks fine but time to fill keeps stretching, the problem often sits upstream: approvals, scorecards, interview scheduling, or slow feedback loops. You can rate your recruitment process to identify these specific bottlenecks.
Role level and function drive most of the spread in cycle time. For non-executive roles, time to fill averages about 44 days in the U.S. [2].
Time to hire shifts by role and seniority [1]:
- Entry-level hires can close in 2 to 6 weeks
- Mid-level individual contributors in 4 to 8 weeks
- Senior ICs in 6 to 10 weeks
- Managers and directors in 8 to 12 weeks
- VP and above roles in 10 to 16 weeks
- C-suite searches in 12 to 20 weeks
Role type adds another layer [1]:
- Sales roles often close in 25 to 35 days
- Software engineering in 40 to 50 days
- Product management in 45 to 60 days
- Data science or ML engineering in 55 to 70 days
Seniority adds time at every step. Each move up the ladder usually adds 20% to 30% to the timeline and 50% to 100% to the cost [1].
For hiring leaders, that has a direct business effect. A delayed senior engineering hire is not just a recruitment issue. It can slow product delivery, stretch team capacity, and push revenue plans off course.
Cost per hire benchmarks for small and midsize employers
Cost per hire is worked out by dividing total internal and external recruiting costs by the number of hires made in a given period [3]. Internal costs include recruiter and HR salaries tied to hiring, hiring manager interview time, and recruiting software. External costs include job board fees, agency fees, background checks, and referral bonuses.
This is about direct recruiting cost only.
For smaller employers, cost per hire usually sits at $3,500 to $5,500 for companies with fewer than 100 employees. For employers with 100 to 999 employees, the range is about $2,500 to $4,500. The 2025 SHRM average for non-executive roles was $5,475, which marks a 33% increase since 2016 [3]. Executive hires average $35,879 [3].
That figure climbs fast when you look at the loaded picture. Loaded cost often reaches $8,000 to $15,000 per hire once you include recruiter labor, lost output during the vacancy, and onboarding time [3].
This is where many teams get caught out. On paper, the hiring budget may look under control. In practice, the business is paying far more through missed output, team strain, and manager time pulled into hiring admin.
What these benchmarks mean for budget and hiring capacity
Use vacancy cost to put a dollar value on delay. Multiply the role’s daily or hourly cost by the days or hours it stays open. Then place that number beside each open role on your hiring dashboard so the business can see the effect in real time [2].
That changes the conversation fast. A role is no longer just "open". It now has a visible cost attached to every extra day.
Cost per hire also shapes hiring capacity. If your budget is built on one number but your loaded cost is much higher, you have a gap. You’re either under-resourced, or hiring spend will run ahead of plan.
For CEOs, CFOs, and HR leaders, this is the point. Speed and cost are capacity metrics. They tell you how many roles you can fill, how much it will cost, and whether your hiring engine can keep up with growth.
Once speed and cost are visible, the next step is to measure where candidates drop out.
Pipeline benchmarks: conversion rates and bottlenecks
Speed and cost tell you how long hiring takes and what it costs. Funnel conversion rates show where the process starts to fail. For high-growth SMEs, that difference matters. The fix for a weak pipeline depends on where candidates are dropping out, often requiring structured talent acquisition services to regain control.
Application-to-offer conversion benchmarks
The biggest drop usually happens at the application-to-screen stage. Benchmarks show that about 8% of applicants pass screening, 37% of screened candidates move to interview, 47.5% of interviews turn into offers, and 69% of offers are accepted. End to end, application-to-hire sits at about 0.6%, or roughly 95 to 180 applicants per hire, depending on the role and source [5].
Role type changes these numbers a lot. Technology roles may need around 191 applicants per hire on average, while healthcare roles may need about 47 [5]. That gap reflects labour market pressure and tighter screening in high-volume technical hiring. Source mix matters too. Referred candidates pass initial screens at 52%, compared with 35% overall. So if you want a clear picture, track benchmarks by source instead of relying on one blended average [5].
| Funnel stage | Benchmark conversion | What it signals |
|---|---|---|
| Application → screen | ~8% | Applicant quality, filter calibration, or review capacity |
| Screen → interview | ~37% | Shortlist quality and recruiter and hiring manager alignment |
| Interview → offer | ~47.5% | Interview consistency and decision speed |
| Offer → accept | ~69% | Compensation, candidate experience, and closing speed |
A table like this helps you spot the problem faster. If application-to-screen is weak, the issue may be your top-of-funnel quality or the way screening rules are set. If interview-to-offer is low, you may have a selection problem, slow decisions, or mixed signals from the panel.
Time in stage and pipeline health
Conversion rates show what is happening. Time in stage shows where it is getting stuck.
A low screen-to-interview rate, paired with long dwell time at the screen stage, usually points to reviewer overload or poor hiring manager alignment, not a weak applicant pool. In other words, the problem is often inside your process, not outside in the market.
Pay close attention to the final interview-to-offer gap. Once that stretches beyond 72 hours, acceptance rates fall as candidates take faster-moving offers [1]. That has a direct business cost. You spend time and salary budget to get to the finish line, then lose the hire because the decision sat too long.
High-growth SMEs typically receive only 4 to 10 applications per role on average [4]. That means even small shifts in sourcing volume can change pipeline health fast. When volume is low, the issue is often source mix. When volume looks fine but conversion is weak, the bottleneck is usually review capacity, interview quality, or decision speed.
Track these numbers on different rhythms:
- Review time in stage and drop-off rates weekly
- Review application-to-hire and offer acceptance monthly
Treat stalled stages as signals. They usually point to a need to fix feedback speed, hiring manager alignment, or sourcing mix. Once the funnel is visible, you can judge whether your accepted hires and your recruiters are driving the outcomes you need.
Outcome benchmarks: hire quality, acceptance, and recruiter output
Speed and funnel conversion tell you how efficient your hiring process is. Outcome benchmarks tell you if the hires were worth it. That matters more.
If hiring gets faster but new starters leave early, miss ramp targets, or frustrate hiring managers, you have not fixed the problem. You have just moved it downstream. These metrics help you check whether fast hiring is also producing hires that stay, perform, and add value.
Quality of hire, early turnover, and stakeholder satisfaction
Only 32% of organisations say they measure quality of hire well, and just 20% tracked it in 2025 [1][2].
That gap is a problem for scaling SMEs. If you are not tracking hire quality, you are making hiring decisions with half the picture.
A practical framework should focus on the metrics that show whether a hire is working in the role:
- Performance
- Time-to-productivity
- 90-day retention
- Hiring manager satisfaction at 30, 60, and 90 days [1]
The average new hire takes 28 weeks to reach full productivity [1]. That is a long ramp. For a CEO, CFO, or HR leader, this has a direct cost. Every weak hire drains manager time, slows team output, and pushes back revenue or delivery targets.
Early turnover inside 90 days is often the clearest sign that something broke in hiring or onboarding. Maybe the role was scoped badly. Maybe the screening missed key gaps. Maybe the onboarding handoff fell flat. Whatever the cause, the cost is hard to ignore.
Replacing a technical employee can cost about 80% of salary. Replacing a manager can hit 200% [1][2].
That is why hire quality should not be treated as a soft metric. It is a cost metric, a time metric, and a business performance metric.
Offer acceptance and recruiter productivity benchmarks
A 75% offer acceptance rate is a solid baseline for SMEs. Strong teams often land in the 85% to 95% range. In the U.S., executive offer acceptance averages 79% [1].
Offer acceptance is one of those metrics that says a lot in a short space. If it is low, the issue is not always compensation. It can point to slow decision-making, poor candidate handling, weak alignment between interviewers, or a process that leaves too much room for doubt.
In one case, setting a 72-hour final-decision deadline pushed acceptance from 64% to 83% [1].
That is a useful reminder: speed at the final stage can change outcomes. When strong candidates are in demand, delay costs money.
On recruiter output, a fair benchmark across mixed SME requisitions is 8 to 15 hires per recruiter per quarter [1]. More than half of organisations also have recruiters handling about 20 active requisitions at once [1].
Those numbers give you a simple capacity check. If your internal team is carrying more than that for long stretches, quality usually drops. Response times slip. Hiring managers get less support. Candidate follow-up gets patchy. The whole process starts to wobble.
How embedded recruiters can improve hiring metrics
Applications per recruiter rose 412% from 2022 to 2025, while recruiter headcount fell 56% [2].
That is the backdrop many hiring teams are dealing with now. More volume, fewer hands, and more pressure to keep quality high.
This is where an embedded recruiter can make a clear commercial difference. You add hiring capacity fast, without building a full internal function from scratch. The recruiter works inside your process, manages hiring end-to-end, and takes pressure off your leadership team and hiring managers.
That can mean:
- Better control of offer stages and follow-up
- More consistency in screening and manager feedback loops
- Less admin drag across the business
- Over 80 hours per month saved in internal hiring and admin time
For scaling companies in SaaS, Technology, IT, Fintech, Engineering, Security, Insurance, and Professional Services, those gains are not small. They affect essential recruitment metrics, team output, and how much leadership time gets pulled into recruitment.
Use these outcome metrics in the monthly and quarterly dashboard that follows.
How to use these benchmarks in a high-growth SME hiring plan
Use the benchmarks above as operating targets, then review them on a simple monthly and quarterly cycle.
Build a monthly and quarterly hiring dashboard
Benchmarks only help if you track them on a steady rhythm. Review monthly efficiency metrics like time to fill, cost per hire, stage conversion, final-interview-to-offer lag, and vacancy cost often enough to spot friction before it slows the business.
Then review quarterly outcome metrics like time to quality of hire, retention, and recruiter output. These need more time, so a longer review cycle makes more sense.
Tie hiring data back to business results. An open role has a daily cost, slower execution, missed revenue, and extra pressure on the team. Show leadership vacancy cost savings in dollars using vacancy cost = (annual salary ÷ 2,000) × 3 × vacant hours. That turns a hiring metric into a financial one, which often helps speed up decisions [2].
Set targets by role family and growth stage
Once your dashboard is live, set targets by role family and by stage of growth. One benchmark number will not fit your whole business [1].
| Role Family | Time-to-Fill Target | Key Watch Metric |
|---|---|---|
| Sales | 25 to 35 days | Offer acceptance rate |
| Technical | About 48 days | Final-interview-to-offer lag |
| Manager / Director | 8 to 12 weeks | Number of interview rounds |
| VP and Above | 10 to 16 weeks | Time to quality of hire |
If you’re scaling fast after a funding round, focus first on trend improvement. That could mean reducing time in stage week over week or cutting final-interview-to-offer lag. It’s a better starting point than locking yourself to a fixed external benchmark while your process is still taking shape [1].
Conclusion: Use benchmarks to improve hiring speed, cost control, and scale
The benchmarks in this article give high-growth SMEs a clear starting point. They show what good looks like, where hiring tends to stall, and which levers change the numbers.
The next step is simple: turn those reference points into internal targets, track them, and act on what the data is telling you.
If your hiring data shows repeat bottlenecks, you may need more structure and more capacity. Rent a Recruiter places experienced recruiters directly into your team to manage hiring end-to-end. You can start with a free Recruitment Health Check to benchmark your current hiring performance and spot where the biggest gains are.
FAQs
Which hiring metrics should I track first?
For high-growth SMEs, start simple.
Track the Big Four:
- Cost per hire
- Time to fill
- Offer acceptance rate
- 90-day retention
Together, these give you a clear baseline for hiring efficiency, market competitiveness, and hire quality.
Once you have that baseline, add funnel metrics like candidate conversion rates and source of hire. That’s where you start to spot what’s slowing hiring down, which channels are pulling their weight, and where you’re spending money without getting the return you need.
How do I know if hiring delays are hurting revenue?
Hiring delays hit revenue in a very direct way. When a role stays open, work slows down, teams stretch to cover the gap, and growth can stall.
In many cases, each day a role stays vacant can cost 1x to 3x the daily salary. That cost often shows up in three places: lost output, overtime, and missed revenue.
If you want to put a number on it, start with the role’s cost of vacancy. A simple way to do that is to divide its annual revenue contribution by 220 workdays. That gives you a daily figure you can use to judge the cost of hiring delays.
From there, track the right hiring metrics. Time-to-fill shows how long it takes to close a role. Time-in-stage shows where the process is slowing down. That’s often where the real issue sits, whether it’s slow interview feedback, approval hold-ups, or too many handoffs.
For CEOs, CFOs, and talent leaders, this matters because every extra day has a cost. The longer the delay, the more revenue and team capacity you lose.
When should I add recruiter capacity?
Add recruiter capacity when hiring demand moves past your team’s bandwidth, or spikes after funding, product launches, or a period of rapid scaling.
In most cases, one recruiter can handle 8 to 15 high-volume roles, 4 to 8 mid-level roles, or 1 to 3 specialist roles per month.
If your hiring forecast shows a steady headcount gap, that’s a clear sign your current setup is under strain. The same applies when recruitment starts pulling time and attention away from core business growth.
At that point, adding capacity is not just about keeping up. It’s about protecting hiring speed, saving leadership time, and avoiding delays that slow revenue plans.