If your hiring data is not helping you cut cost, save time, or fill roles faster, your reports are not doing their job.
I’d boil this article down to one point: most SMEs do not need more dashboards, they need a small set of repeatable recruitment reports tied to decisions. The article shows 10 report templates that turn ATS, HRIS, and finance data into actions on hiring speed, source spend, recruiter capacity, retention, and diversity. For leaders in SaaS, Technology, IT, Fintech, Engineering, Security, Insurance, and Professional Services, that means better control over metrics like time-to-fill, cost-per-hire, offer acceptance, and pipeline drop-off.
What I’d take from it is simple:
- Use executive summaries for headcount, budget, and hiring priority calls
- Use weekly performance and funnel reports to spot stalled roles and stage delays early
- Use source and cost reports to move spend away from weak channels
- Use role, team, and quarterly scorecards to check hiring output against business results
- Use one fixed reporting structure so month-on-month comparisons stay clean
A few numbers frame the issue fast:
- Non-executive hiring often takes 44 to 45 days
- Cost-per-hire often sits around $4,700 to $5,475
- Offer acceptance often lands near 85% to 95%
- Application-to-hire rates can be as low as 0.5% to 2%
That is why reporting matters. If you miss the leak in your funnel, the cost shows up later in delayed projects, lost capacity, and extra spend. To identify these leaks, you can rate your recruitment process with our free health check tool.
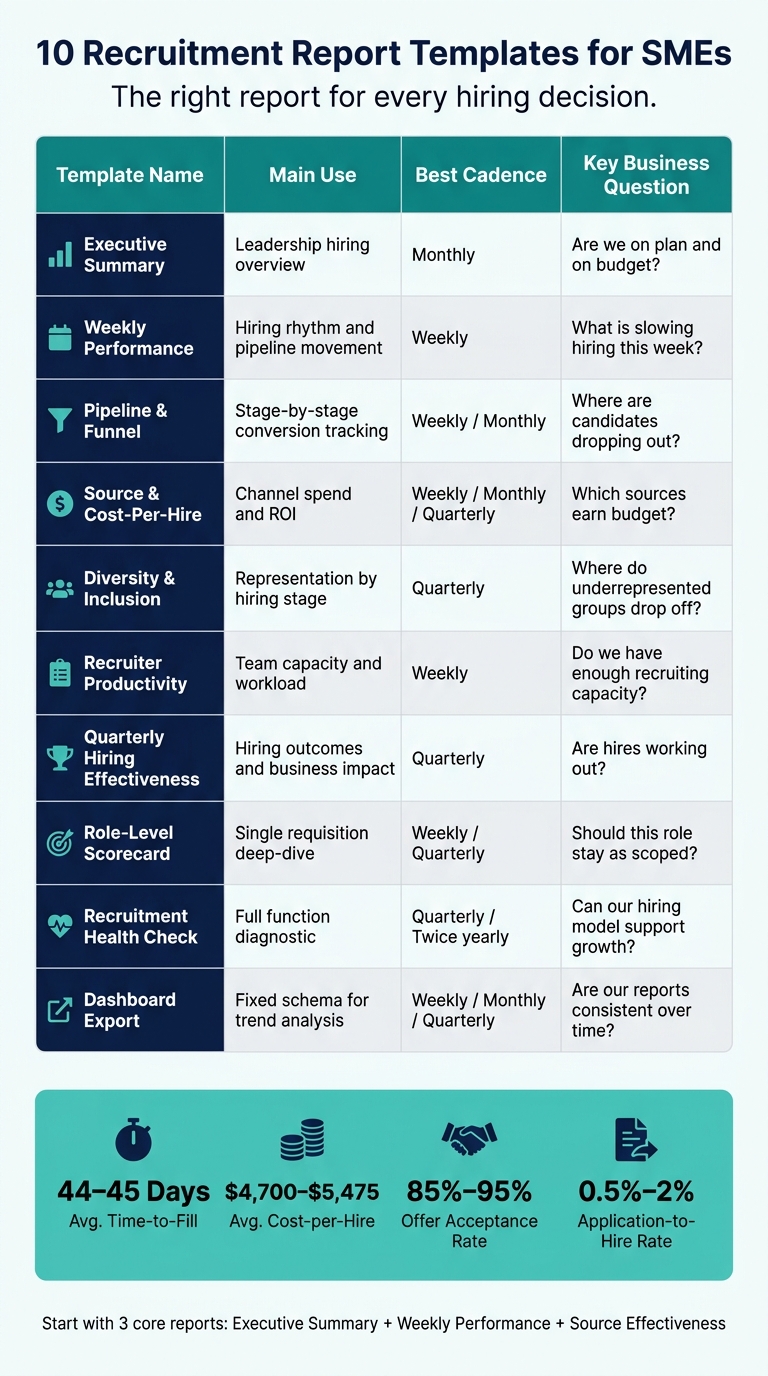
10 Recruitment Report Templates for SMEs: Quick Reference Guide
Create Your Own HR Recruitment Tracking Application & Dashboard In Excel + Free Template Download
sbb-itb-a23bd6a
Quick comparison
| Template | Main use | Best cadence | Main business question |
|---|---|---|---|
| Executive summary | Leadership view | Monthly | Are we on plan and on budget? |
| Weekly performance | Hiring rhythm | Weekly | What is slowing hiring this week? |
| Pipeline and funnel | Stage conversion | Weekly / Monthly | Where are candidates dropping out? |
| Source and cost-per-hire | Channel spend | Weekly / Monthly / Quarterly | Which sources earn budget? |
| Diversity report | Representation by stage | Quarterly | Where do groups drop off? |
| Recruiter productivity | Team capacity | Weekly | Do we have enough recruiting capacity? |
| Quarterly hiring effectiveness | Hiring outcomes | Quarterly | Are hires working out? |
| Role-level scorecard | Single role review | Weekly / Quarterly | Should this role stay as scoped? |
| Health check | Function review | Quarterly / Twice yearly | Can our hiring model support growth? |
| Dashboard export | Fixed data structure | Weekly / Monthly / Quarterly | Are our reports consistent over time? |
The article then walks through when to use each template, which essential recruitment metrics to track, and which systems should feed the report.
What Makes a Recruitment Report Template Useful for SMEs
The best recruitment report templates for SMEs are built for routine use.
In practice, that means a recruiter or HR generalist can finish an update in 30 to 60 minutes per reporting cycle using data you already have in your systems. The aim is simple: a lightweight report that fits how your team already works, not a heavy BI project that drains time and budget.
Each template should answer one hiring question.
For example, are your priority roles on track? Where are candidates dropping out of the funnel? If one report tries to answer everything, it usually ends up helping no one.
This is why simple table formats work so well. Simple tables deliver the most value. A one-page table showing open roles, days open, stage counts, and risk status lets a hiring manager spot issues in seconds. A source comparison table with candidates generated, interviews, offers, hires, and cost-per-hire by channel makes it much easier to shift budget where it will have the biggest effect.
For most SMEs, this is where reporting either sticks or falls apart.
Data cleanup is usually the problem. If a template needs manual reformatting, custom category mapping, or multiple exports stitched together every month, it often dies after the first cycle. That kind of admin adds up fast, and busy teams drop it.
The fix is straightforward. Match your ATS field labels exactly. Use stage names like "Applied", "Phone Screen", "Onsite Interview", "Offer", and "Hired" so the report becomes mostly an export-and-paste job. Cost fields can sit in a simple finance spreadsheet.
It also helps to give one person clear ownership of field mapping and reporting cadence. Without that, even a good template can drift. The templates below follow these rules in different reporting formats.
1. Executive Summary Recruitment Report Template
The executive summary gives leadership a fast read on hiring progress and risk. This template turns raw hiring data into a leadership-level view. It should answer three clear questions: Are you on plan? Are you hiring efficiently? Are new hires staying?
This report is not for day-to-day recruiter activity. It is for decisions that affect headcount, budget, and hiring priority.
Primary decision use
Use this template to support leadership decisions, not recruiter-level tracking. If a CEO, CFO, or HR leader can’t scan it in a minute or two, it’s too long.
Keep it to one page. Add a short narrative that covers key wins, current risks, and the actions you want leadership to approve.
Core metrics included
For SMEs, every metric should link back to budget, team capacity, or hiring priority. If a number does not drive action, cut it.
| Metric | What It Tells You | Benchmark / Guidance (U.S.) |
|---|---|---|
| Hires vs. plan | Progress against hiring plan | Varies by hiring plan |
| Median time-to-fill | Speed to fill | 21 to 42 days for SMBs [6] |
| Offer acceptance rate | Offer strength | 85% to 95% accepted [4] |
| Cost-per-hire | Recruiting spend per hire | About $4,800 to $5,475 for non-executive roles [5][7] |
| 90-day retention | Early retention | Track early attrition and compare against target [6] |
| Pipeline health | Open roles, stage volume, and aged requisitions | Flag roles with a thin or aging pipeline |
Always show each metric against a target or a prior period. A number on its own does not help leadership decide anything.
Best reporting cadence
For most SMEs, monthly reporting is the default. That gives leadership enough visibility to spot slippage before it turns into missed hiring targets or budget creep.
Use quarterly roll-ups for board reviews and budget planning, where the focus shifts from weekly movement to bigger hiring patterns and spend control.
Required data sources
You don’t need a huge stack to build this report. A small set of systems usually covers it:
- Your ATS for pipeline metrics, time-to-fill, and offer outcomes
- Your HRIS or payroll tool for start dates, early attrition, and headcount checks
- A basic finance export for job board spend, agency fees, and recruiter costs
- A monthly survey for hiring-manager satisfaction
Use consistent U.S. formatting throughout: $3,750, 09/19/2026, and 1,250.
The next template breaks hiring performance down by week.
2. Weekly Recruiting Performance Report Template
This is your weekly operating view. It shows where the pipeline is slowing down right now, this week, not at some high level in a monthly wrap-up.
Use the executive summary for leadership calls. Use this report for weekly action.
Primary decision use
Use this report to:
- shift sourcing spend
- speed up hiring manager feedback
- flag stalled roles
- escalate at-risk offers
If hiring is slipping, this is usually where you see it first.
Core metrics included
Focus on movement, not just totals.
Forty applicants tell you almost nothing if none of them make it to screening. What matters is whether candidates are moving through the funnel or getting stuck.
| Metric | What It Tells You |
|---|---|
| Open roles and requisition age | Which roles are aging past your SLA |
| New candidates added (by source) | Whether inbound volume is healthy |
| Stage-by-stage conversion rates | Where candidates are dropping off |
| Screens, interviews, offers, and hires this week | Overall throughput for the week |
| Median time-in-stage | Where the pipeline is slowing down |
| Offer acceptance rate | Whether offers are landing or being declined |
Treat these numbers as weekly warning signs.
The average application-to-hire rate sits at roughly 0.5% to 2%, or about one hire per 180 to 200 applications[8][9]. If a mid-level role has been open for more than 30 days, it needs attention. The same goes for any candidate with no stage movement in the past 7 to 14 days[10][11].
That kind of delay often means one of two things: weak pipeline quality or slow internal decision-making. Either way, it costs time and pushes hiring spend in the wrong direction.
Best reporting cadence
Run the report at the end of each week and review it in the next hiring meeting.
Look at week-over-week change, not raw totals on their own. A static number can hide a problem. A drop in screens, slower interview completion, or more candidates sitting idle tells you far more.
Required data sources
Pull stage data, conversion rates, and requisition age from your ATS.
Add data from your scheduling tool for time-in-stage and interview completion rates. If external recruiters are involved, include their activity as well. You need one view of total hiring output, so you can shift spend before the next posting cycle.
Keep manual inputs light. Use them only for ATS gaps, like delayed manager feedback or offer declines logged only in notes.
The next template breaks this weekly flow down into where candidates are dropping out.
3. Candidate Pipeline and Funnel Conversion Report Template
The weekly report shows volume. This report shows leakage.
It helps you see where candidates fall out between application and accepted offer, so you can spot weak points in the funnel instead of just looking at total hiring activity. If one stage is dragging down outcomes, this template makes it plain.
Primary decision use
Use this report to find the stage that is losing candidates, then fix that stage first.
Core metrics included
Track these metrics at each stage:
| Metric | What It Tells You |
|---|---|
| Applicants per stage | Volume moving through each step |
| Stage-to-stage conversion rate | Where candidates are dropping off |
| Overall applicant-to-hire rate | Applications-to-hires conversion |
| Time-in-stage | Where the process is slowing down |
| Offer acceptance rate | Whether offers are competitive |
| Pipeline coverage ratio | Whether you have enough candidates per open role |
Benchmarks help you spot leaks fast:
- Application-to-screen: 15% to 25%
- Screen-to-first interview: 30% to 50%
- Offer acceptance: 80% to 95%
If your numbers sit well below these ranges, the template shows which stage needs attention first. That matters because not every hiring issue is a top-of-funnel problem. Sometimes the issue is scheduling. Sometimes it is interview quality. Sometimes your offer simply is not landing.
Best reporting cadence
Run this report weekly during active hiring and monthly for trend analysis.
A weekly pull gives recruiters and hiring managers enough time to act before a role slips past its target fill date. That could mean adding sourcing volume, tightening scheduling, or reviewing evaluation criteria.
Required data sources
Your ATS should be the main source. It holds the stage timestamps, candidate status changes, and requisition data needed to calculate conversion rates and time-in-stage with accuracy.
Pair that with sourcing platform data, such as job boards, referrals, and direct outreach, so you can break funnel performance out by source. That gives you a clearer view of where strong candidates come from and where spend or recruiter time may be going to waste.
If your ATS has gaps, close them with one standard manual process. Use dropdowns, not free text. That small change makes reporting cleaner and saves time when your team reviews hiring performance.
Use this report to pinpoint stage drop-offs; compare channels in the source effectiveness report.
4. Source Effectiveness and Cost-Per-Hire Report Template
Once you’ve rated your recruitment process and spotted where candidates drop out, the next step is simple: find out which sources are producing hires worth paying for.
This report helps you measure source quality, not just source volume. A channel that sends 300 applicants may look busy, but if only a handful are qualified, it can still be a poor use of budget. You need to compare volume, quality, speed, and cost across job boards, LinkedIn, referrals, agencies, and your careers site. That’s how you tie spend to hiring outcomes by source.
The commercial value is clear. If employee referrals are producing hires at $1,500 per hire with 90% 12-month retention, while an agency costs $18,000 per hire with 75% retention, that gap speaks for itself. This is the kind of report that helps you move budget with confidence. Use it each quarter to decide which channels to fund, scale, or cut. It also gives you a clear basis for subscription renewals and agency spend decisions.
Primary decision use
Use this report to decide which channels still earn budget and which ones need to be reduced.
Core metrics included
The table below covers the minimum metrics this template should track:
| Metric | What It Tells You |
|---|---|
| Applicants per source | Raw reach of each channel |
| Qualified candidates per source | Which sources attract relevant talent |
| Interviews per source | How well each source moves candidates into the funnel |
| Offers extended and accepted per source | Offer acceptance performance by channel |
| Hires per source | The final conversion outcome |
| Source-to-hire conversion rate | Hires ÷ total applicants per source |
| Cost-per-applicant | Total source spend ÷ applicants |
| Cost-per-qualified candidate | Total source spend ÷ qualified candidates |
| Cost-per-hire by source | Total source spend ÷ hires from that source |
| Time-to-fill by source | Speed comparison across channels |
| 12-month retention by source | Long-term quality of each source |
| 90-day attrition or probation pass rate | Early quality signal, if you track it |
Use a source-by-row layout with filters for role, department, and date. That keeps the report easy to read and lets you drill into problem areas fast.
For cost-per-hire, use the SHRM/ANSI formula as your baseline: (Internal Costs + External Costs) ÷ Total Hires. Apply that formula at the channel level so you can compare sources directly. In the U.S., cost-per-hire often lands around $4,700 to $4,750, and smaller businesses often come in higher. If one source sits well above that range and still doesn’t produce better quality, it needs a harder review.
Best reporting cadence
During active hiring, run a weekly or bi-weekly view so you can catch weak campaigns before they burn through budget.
Then use a monthly review to compare hires, cost-per-hire, and early attrition across all sources. That gives HR and finance a shared view of what’s paying off.
Each quarter, use the report for bigger decisions:
- Which subscriptions to renew
- Whether to cut back agency use
- Where recruiter time should shift
Required data sources
Your ATS should cover source tagging, stage progression, and time-in-stage data. Finance or accounting should provide actual spend, including job board invoices, agency fees, ad subscriptions, and referral rewards. HRIS or payroll should supply retention and attrition data.
Data discipline matters here. Standardize source tags and make source a required ATS field. Blank values or "Other" weaken the report and make channel comparison less reliable. A fixed source taxonomy gives you cleaner reporting and better budget calls.
5. Diversity and Inclusion Recruitment Report Template
If your source report tells you where hires come from, this template tells you whether those hires are fair across groups. Drop-off data on its own only gets you so far. You need to know which candidates are falling out of the funnel, and at what point. This report tracks representation and conversion rates across demographic groups at each stage of hiring.
Primary decision use
Use this report to spot where underrepresented candidates drop off, which channels bring in diverse qualified talent, and whether hiring targets are on track by role and level. From there, you can tighten rubrics, move sourcing budget, or add structured assessments where the process looks uneven.
The main signal here is conversion, not representation alone.
Core metrics included
Track conversion from application to hire by self-reported group, using U.S. EEOC categories.
| Metric | What It Tells You |
|---|---|
| Applicant pool diversity | Share of applications by demographic group per role and department |
| Stage-by-stage conversion by group | Where specific groups are disproportionately filtered out |
| Offer rate by demographic group | Potential bias in final decision-making |
| Offer acceptance rate by demographic group | Whether certain candidates are less likely to accept |
| Diversity of hires vs. applicant pool | Whether diverse candidates are converting at equitable rates |
| Source-level diversity metrics | Which channels produce diverse, qualified candidates |
| Goals vs. actuals | Progress against diversity hiring targets, by quarter |
Show these metrics as both percentages and counts. Percentages let you compare groups cleanly. Counts show scale, which stops small datasets from being read the wrong way.
Best reporting cadence
For most U.S. SMEs, a quarterly cadence works best. It gives you enough data to spot patterns that matter without letting small sample sizes skew the picture. It also lines up with normal business planning cycles, including headcount reviews, DEI planning, and budget calls.
In high-volume hiring periods, add a monthly snapshot on top. Keep it tight. Focus on top-line numbers such as applicant pool representation, key conversion rates, and hires by group. The point is to catch issues early, not build a full report every four weeks.
Required data sources
Clean ATS and HRIS data make or break this report.
Your ATS should be the main source for application dates, stage changes with timestamps, source tags, disposition reasons, and any voluntary demographic data candidates submit. That last part matters. Demographic collection should be clearly marked as voluntary, kept away from hiring decision-makers, and used only in aggregate.
Your HRIS or payroll system should provide hire dates, role levels, departments, and work locations. If you also run inclusion surveys or pulse checks, bring those in as a second layer. That gives you a fuller view, not just who got hired, but whether people feel included once they join.
Suppress any slice with fewer than 5 to 10 individuals, and report patterns only, never individual profiles.
6. Recruiter and Team Productivity Report Template
Use this report to check whether your recruiting capacity is keeping up with hiring demand, and to spot workload gaps before they slow hiring or push the team too hard. It helps you separate a capacity problem from a process problem.
Primary decision use
For SMEs, this report shows whether your team can deliver hires with the capacity already in place.
If one recruiter is carrying far more active searches than another, that usually points to a capacity issue, not just an individual performance issue. That matters, because the fix is different. You may need to rebalance workloads, reset hiring targets, or add support, rather than assume someone is underperforming.
Use it to:
- redistribute work across the team
- set realistic hiring targets
- make better calls on team capacity
Core metrics included
Track hours per requisition to estimate capacity. That gives you a clearer picture of how much work your team can actually handle, not just how many roles sit open on paper.
| Metric Category | What to Track | Data Source |
|---|---|---|
| Output | Placements, candidates screened | ATS |
| Speed | Time-to-fill, time-to-hire, time spent on reporting and interview transcription | CRM / timesheets |
| Workload | Active requisitions per recruiter, interviews conducted | Project management tools / call logs |
Track active requisitions per recruiter against a set capacity target as a core workload signal. If that number creeps too high, hiring quality and speed usually take the hit next.
Best reporting cadence
Use a live view for weekly manager check-ins.
That gives hiring leaders a current read on team load, rather than waiting until delays show up in time-to-fill.
Required data sources
Pull output from your ATS or AI tools. Then use CRM, project management, call log, and timesheet data to track speed and workload.
This report helps you see whether staffing capacity, not just pipeline volume, is limiting hiring.
7. Hiring Effectiveness Quarterly Report Template
The last template tracks recruiter activity. This one tracks hiring results.
That matters because filled roles don’t always mean good hiring. A quarterly view shows whether new hires are sticking, performing, and adding value to the business, not just taking up seats.
Primary decision use
Use this report to judge whether hiring is helping your revenue, product, and customer goals over the next 6 to 12 months. It should also tell you if recent hires are staying long enough, performing well enough, and ramping fast enough to justify the time and cost.
This is especially useful after funding rounds or product launches, when hiring demand jumps and priorities can change fast. A clear quarterly view gives you time to course-correct before small issues turn into expensive ones.
Core metrics included
Group the metrics into four areas: quality, speed, cost, and business impact.
For quality of hire, use a combined view of:
- 90-day retention
- Performance review scores at 6 and 12 months
- Hiring manager satisfaction at 90 days
For speed, 40 to 45 days is a common baseline. Technical roles often take 60 to 90+ days.[14][15][16]
| Metric Area | What to Track |
|---|---|
| Quality | Composite of 90-day retention, 6- and 12-month performance scores, and 90-day hiring manager satisfaction |
| Speed | Time-to-fill, time-to-start, interview-to-offer ratio |
| Cost | Cost-per-hire ($), cost of vacancy, agency vs. internal cost mix |
| Business impact | Time-to-productivity, vacancy impact on projects or revenue, coverage of critical roles |
First-year attrition in the U.S. is often 25% to 35%,[13] so early retention is one of the clearest signals in this report.
Best reporting cadence
Run this report every quarter. Compare quarter-over-quarter results, and use year-over-year comparisons where they help add context.
Required data sources
Pull data from your ATS, HRIS/payroll system, performance tools, survey data, and finance data into one spreadsheet. Use MM/DD/YYYY date formatting and keep role names consistent across sources.
Use the next template when you need the same view split by role.
8. Role-Level Hiring Scorecard Template
Where the quarterly report shows hiring performance across the business, this scorecard goes deep on one role. It gives you a requisition-level view, not just a portfolio view, so you can assess outcomes, process, and hire quality in one place.
That matters when one hire is slowing the business down. You can use this template to decide whether a specific role should keep moving as planned, be reworked, or be paused.
Primary decision use
Use this template when a role is proving hard to fill, the pipeline is thin, or you’re facing other challenges in recruitment like misaligned pay.
If nobody is clearing the pass mark, don’t just push sourcing harder. First, revisit the role scope, must-haves, or compensation. That gives you one clear standard to assess against, instead of a pile of mixed interviewer views.
Core metrics included
Keep competencies tight, five to seven per role is enough. The table below shows what to track in each area.
| Metric Area | What to Track |
|---|---|
| Speed | Time-to-fill, time-to-start, days in stage |
| Quality | Interview score on a 1–4 or 0–100 scale, competency scores, hiring manager satisfaction (1–5), 90-day performance rating [17][18][19][20] |
| Cost | Cost-per-hire in USD, for example $7,500.00, budget variance, for example budget $5,000.00 vs. actual $7,500.00, +$2,500.00 variance [17][18][20] |
| Outcomes | Offer-accept rate, early attrition flag (Yes/No), role-specific performance indicators, for example quota attainment or ticket resolution speed |
Best reporting cadence
While a role is live, review the scorecard weekly. Look for drop-off points, delays between stages, and signs that the shortlist isn’t matching the brief.
Once the role is filled, shift to a monthly or quarterly review. At that point, the focus moves to quality of hire, early attrition, and 90-day performance. For business-critical individual hires during high-growth periods, a weekly leadership review is often time well spent [2][12].
Required data sources
Pull pipeline and conversion data from your ATS. Use your HRIS for start dates and compensation in USD. Use your performance system for 90-day ratings.
For SMEs, the goal is simple: one consistent view of one requisition, even if the data sits across separate exports. Smaller teams can export CSV files from each system and combine them in a spreadsheet.
Use a consistent req ID and role name as the link across sources, and keep MM/DD/YYYY formatting in every file [21][12].
9. Recruitment Health Check and Diagnostic Report Template
Where a scorecard looks closely at one role, this template looks at the full hiring function. It answers a simple business question: Is your recruitment engine in good enough shape to support your growth plan? Use it when you need to test whether your hiring system can handle the next phase of growth.
This is not a day-to-day report. It is a periodic diagnostic built to spot system risks, process gaps, and capacity strain before they turn into hiring blockers. In plain terms, it helps you see trouble early, before hiring slows down and growth takes the hit.
Primary decision use
Use this template at key moments in the business. That could be before a planned headcount push, after a funding round, or after repeated hiring misses.
It supports decisions such as:
- whether to add recruiter capacity
- whether interview stages need to be redesigned
- whether sourcing channels should change
- whether to bring in an embedded recruiter to steady the function
This report is less about what happened last month. It is about whether your process can cope with what comes next.
Core metrics included
Unlike weekly or monthly dashboards, this template highlights structural problems that need changes in process or team capacity. A useful health check covers five diagnostic areas: capacity, speed, quality, cost, and risk.
| Diagnostic Area | What to Track |
|---|---|
| Capacity | Open roles per recruiter vs. capacity target; overloaded recruiters; hiring manager interview hours per week; recruiter FTE vs. open demand |
| Speed | Time-to-fill variance by department; stage bottlenecks; time-to-start gaps |
| Quality | 90-day retention rate; probation pass rate; first-year attrition rate; hiring manager satisfaction score (1–5) |
| Cost | Cost-per-hire in USD; agency vs. direct hire mix; internal hours spent on recruiting per month |
| Risk | Critical roles open beyond SLA; aging requisitions; ATS data completeness; stage-to-stage conversion drop-offs |
Each row should help you answer three things: Can the team absorb demand? Where is the bottleneck? What risk is building?
The U.S. median time-to-fill sits around 44 to 45 days. A vacant $80,000 role costs about $307 per day, or roughly $13,500 over 44 days.[1]
Best reporting cadence
Run a full health check quarterly during periods of change, or twice a year when hiring is steady. This is a business review tool, best tied to quarterly business reviews or board updates. It should not replace your weekly or monthly recruiting dashboard.
Required data sources
Pull pipeline data, stage timestamps, and source tags from your ATS. Use your HRIS or payroll system for start dates, attrition, and compensation in USD.
Add survey data for candidate experience and hiring manager satisfaction. Pull finance records for agency invoices, job board spend, and tool subscriptions. For employer brand signals, platforms like Glassdoor and Indeed can show sentiment themes that affect pipeline quality.
If you are an SME without a dedicated TA team, assign one clear owner for the health check, the data mapping, and the follow-through.
10. Recruitment Analytics Dashboard Export Template
After the health check, use this export to track hiring performance over time in a fixed, analysis-ready format. Set it up as a reusable CSV or XLSX file with a fixed schema, so your team can refresh it each reporting period without rebuilding the structure.
This gives leadership and hiring managers a single view across roles, sources, stages, and recruiters. That matters if you want hiring tracked against headcount plans and budget, not just reported after the fact. Unlike static PDF reports, a fixed schema makes month-over-month and quarter-over-quarter comparisons much easier.
Your export should cover volume, speed, quality, cost, and diversity.
For speed, track:
- Time-to-fill in days
- Time-to-hire in days
- Average time spent in each stage
For quality, include offer acceptance rate, pass-through rates between stages, and 90-day attrition for new hires. A healthy offer acceptance rate is 85% to 90%, and a strong 12-month new-hire retention rate is around 90%.[3]
For cost, record total recruiting spend in USD, broken out by job board fees, agency invoices, and internal recruiter hours. Then divide total spend by hires to calculate cost-per-hire. The U.S. average cost-per-hire is about $4,700, though tech roles often come in higher.[22]
You should also include source-level applications, interviews, hires, conversion rates, and diversity pass-through fields. That way, you can see not just where candidates come from, but which channels turn into hires at a cost and pace your business can support.
Use the same schema on different reporting cadences:
- Weekly for recruiters
- Monthly for managers
- Quarterly for leadership
Only the time window changes. The structure stays the same, which keeps trend reporting clean and cuts time spent fixing reporting issues later.
Build the export from ATS, HRIS, finance, and survey data so each refresh stays comparable. Your ATS should supply role data, stage timestamps, source tags, and candidate outcomes. Your HRIS or payroll system should add start dates and early attrition figures. Finance or accounting records should provide actual spend in USD. Survey tools can add hiring manager satisfaction and candidate experience data.
To keep records aligned across systems, standardize:
- Dates as MM/DD/YYYY
- Currency as $X,XXX.XX
- Numbers as 1,234.56
- A shared role ID across all systems
That shared role ID is the glue. Without it, cross-system reporting turns into spreadsheet patchwork, and that usually means wasted time, messy data, and less trust in the numbers.
Fields and Table Layouts to Include in Every Template
If you want reports that are easy to update and easy to compare, start with the same shared fields in every template.
Use one standard header each time:
- Report title
- Reporting period
- Date prepared
- Owner
- Audience
- Scope
- Data source
Keep dates in MM/DD/YYYY format and use USD ($) throughout.
For core hiring metrics like hires completed, time-to-fill, and cost-per-hire, don’t show a single number on its own. Put a target vs. actual table beside a period-over-period view so leadership gets two things at once: a current snapshot and a clear trend line.
| Table Type | Columns to Include |
|---|---|
| Target vs. actual | Metric, Target, Actual, Variance, Variance % |
| Period-over-period | Metric, Current Period, Prior Period, Change, Change % |
| Role-level | Role, Hiring Manager, Open Since Date, Target Hire Date, Status, Time-to-Fill |
| Source effectiveness | Source, Applications, Interviews, Offers, Hires, Offer Acceptance Rate %, Cost ($), Cost-per-Hire ($) |
Each template should also end with a short notes section. Not a wall of text. Just structured bullets that help people act on what they’re seeing.
Use bullets for:
- Key risks
- Assumptions
- Actions
- Owners
- Due dates
This is where a lot of teams go wrong. They try to pack everything into one report, and the result is clutter. A better approach is to keep each template tied to one objective, two or three core tables, and three to five key metrics.
Anything else should sit in a secondary table or a separate document. That way, leadership can move from report to decision with less back-and-forth and less wasted time.
Turning Recruitment Reports Into Better Hiring Decisions
The templates above only matter if they lead to action.
For SMEs, each report should work as a decision tool. It should answer one business question and prompt one next step. The aim is not more reporting. The aim is faster hiring decisions.
Cadence shapes who acts, and when. Weekly reports help with day-to-day movement. Monthly reviews show source quality and where hiring slows down. Quarterly reviews help you look at headcount, cost, and whether your hiring model still fits.
For SME teams, keep ownership simple. Recruiting owns the data. The business owner makes the call.
Take a source effectiveness report. Recruiting may own it, but finance should review it too. That makes it easier to decide whether to move budget away from channels that underperform and into the sources that convert best. That’s not just admin. It’s a direct cost decision.
When a metric slips outside target, the report should point to one clear response. If your offer acceptance rate drops below target, the next move should be obvious:
- benchmark compensation
- speed up offer turnaround
- review candidate experience more closely
Good reporting removes guesswork. For more insights on optimizing your hiring process, explore The Talent Fix recruitment blog. You spend less time debating what happened, and more time fixing it.
If reporting gaps come from limited team capacity, Rent a Recruiter can place experienced recruiters inside your team within days. That gives you more hiring capacity, better reporting structure, and lower hiring costs.
Conclusion
SMEs don’t need a huge reporting stack. You need a small set of reports tied to hiring decisions, and you need to use them the same way every time.
Start with the reports that answer your most urgent hiring questions. Begin with three: the executive summary, the weekly performance report, and the source effectiveness report. Together, they cover the core issues in hiring: status, movement, and spend.
For teams just getting started, that’s enough. These three reports give you a clear view of where hiring stands, what’s moving, and where your budget is going.
Once those basics are in place, only add more when the data points to a repeat problem. If pipeline gaps keep showing up, add a funnel conversion report. If representation becomes a tracked business goal, add a diversity report. In other words, don’t build more templates for the sake of it. Add them when a recurring hiring issue shows up.
That same consistency helps with planning. Over time, weekly and monthly reporting gives you a planning baseline you can trust. It becomes easier to forecast headcount earlier, budget with more confidence, and set timelines that match hiring reality.
Shared reporting also gives recruiters, hiring managers, and leadership one version of the truth. Standardised reports make hiring easier to see, compare, and manage. That’s when recruitment reporting stops being admin and starts supporting growth.
When reporting gaps come from limited team capacity, Rent a Recruiter can place experienced recruiters into your team fast.
FAQs
Which recruitment reports should we build first?
For scaling SMEs, start with a dashboard built around the Big Four: cost per hire, time to fill, offer acceptance rate, and 90-day retention.
These four metrics give you a clear baseline for hiring performance. They show what you’re spending, how long hiring takes, whether your offers are landing, and whether new hires stay long enough to prove the process is working.
Once you have that baseline, add funnel metrics like candidate conversion rates and source of hire. That’s where you start to spot bottlenecks, cut wasted spend, and put more of your budget into channels that actually deliver hires.
How can we standardize hiring data across our ATS, HRIS, and finance tools?
Set up a single source of truth for each metric by assigning one system of record to every data point. For example, use your ATS for time-to-fill and your HRIS for retention.
Then build a shared data dictionary that defines metrics like hire dates and source attribution. Standardise required ATS fields, stage names, and source labels so teams enter data the same way, every time.
Why does this matter? Because if Finance, HR, and Talent are all working from different definitions, your reporting falls apart fast. Clean inputs lead to clear hiring data, and that gives you a better handle on cost, speed, and team performance.
How often should SMEs review recruitment reports?
SMEs should review recruitment reports on a tiered schedule so the data stays useful, timely, and tied to business goals.
- Weekly: 20 to 30 minute check-ins to deal with immediate bottlenecks before they slow hiring down
- Monthly: 45 to 60 minute leadership reviews covering time-to-hire, cost-per-hire, and source performance
- Quarterly: audits of longer-term trends, retention, and your overall hiring strategy