I recommend tying diversity metrics to one hiring goal: filling priority roles on time, controlling costs, or keeping new hires. Start with a 12-month baseline, compare similar roles, and assign one owner to review results.
SHRM reported that 74% of surveyed organisations tracked diversity in new hires, but only 47% tracked it in retained employees.[3] That gap matters when you’re budgeting for replacement hires.
My starting checklist:
- Pair demographic data with hiring speed, cost per hire, and retention.
- Review funnel conversion to find where your hiring plan may stall as you scale.
- Protect personal data and check sample sizes before drawing conclusions.
- Test process changes against the same measures.
<u>The aim is better hiring outcomes</u>, not representation alone. Treat differences as signals to investigate, while keeping hiring standards consistent.
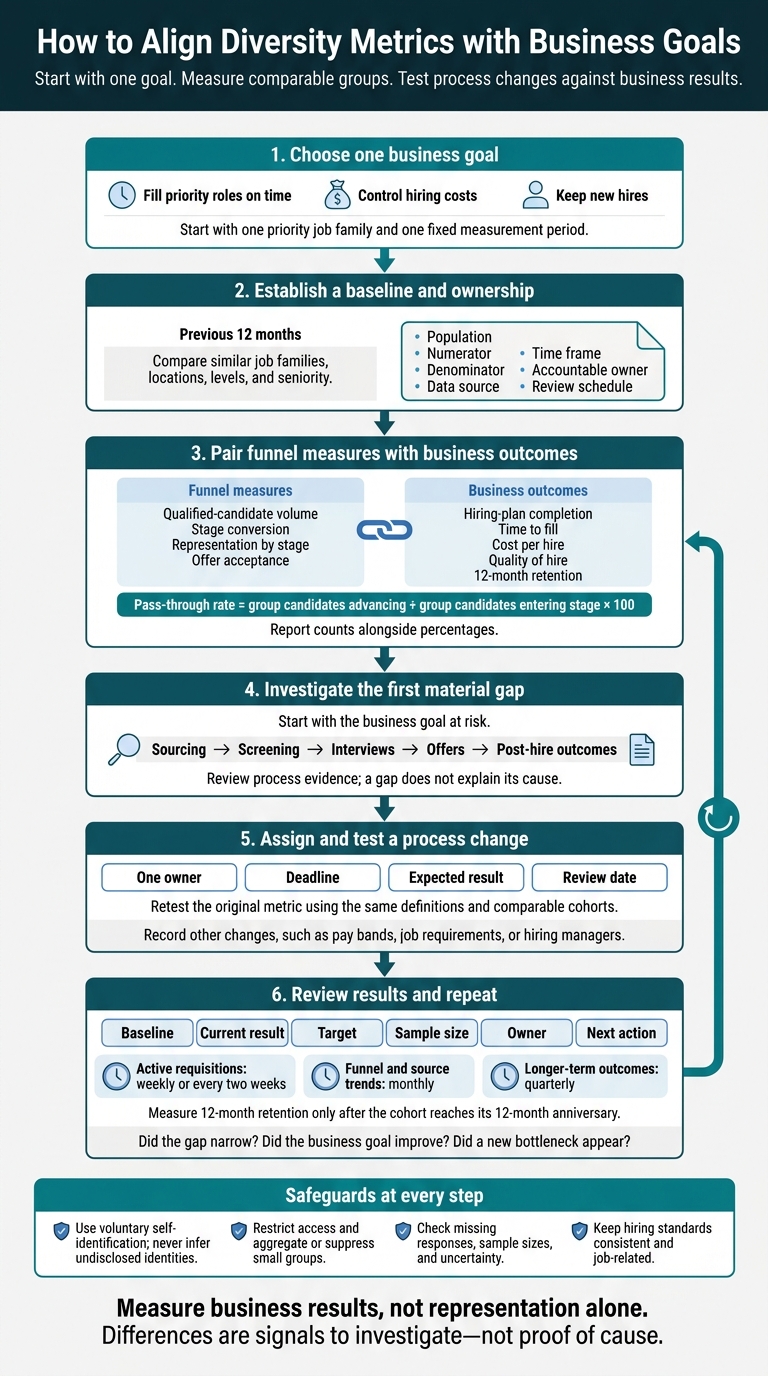
How to Align Diversity Metrics with Business Goals
How to Benchmark DEI in the Workplace
sbb-itb-a23bd6a
1. Set Business Goals, Baselines, and Responsibilities
Start with your workforce plan: priority roles, hiring volume, seniority, location, deadlines, and recruiting capacity. Every dashboard metric should support a decision. Before adding one, name the business constraint it addresses and connect it to a hiring decision, business risk, or workforce outcome.
Match Hiring Metrics to Business Goals
Use the table below to connect hiring decisions with diversity-related measures. These are measurement relationships, not proof that representation alone causes better business results.
| Business goal | Diversity-related outcome | Primary metric | Metric owner | Review frequency |
|---|---|---|---|---|
| Enter a new U.S. talent market | Reach qualified candidates across the target market | Qualified applicants by location and demographic group | Recruiting operations | Monthly during expansion |
| Deliver the hiring plan | Build a qualified pipeline | Qualified candidate volume and stage conversion by group | Recruiting manager | Weekly during active hiring |
| Build leadership capacity | Measure internal advancement into leadership | Representation and promotion rates by level | People analytics | Quarterly |
| Improve retention | Compare outcomes across new-hire cohorts | 6- and 12-month retention by group and job family | HR analytics | Quarterly |
| Control hiring costs | Identify efficient sources without narrowing access | Cost per qualified applicant and hire by source | Recruiting operations, with finance | Monthly |
Establish Baselines and Assign Metric Owners
Use the previous 12 months as your baseline, broken down by job family, location, and seniority. Compare candidate reach against relevant, qualified local labor-market data, not overall national demographics. Flag small samples, missing responses, and hiring-process changes that make comparisons less reliable.
Create a metric definition sheet that records the population, numerator, denominator, data source, time frame, accountable owner, and review schedule. Use voluntary self-identification, and keep “unknown” and “declined” responses visible.
Track sourcing access, evaluation consistency, and post-hire outcomes separately. This helps each owner see where to investigate, rather than treating every gap as a sourcing problem.
| Metric | Metric owner | Trigger | Corrective action | Escalation point |
|---|---|---|---|---|
| Qualified-candidate reach | Recruiting operations | A material decline across two review periods | Rebalance sourcing channels and audit campaign targeting | Head of talent acquisition |
| Screen-to-interview conversion | Recruiting manager | Sustained group difference within comparable roles | Review minimum qualifications, scorecards, and reviewer calibration | HR business partner |
| Interview-to-offer conversion | Hiring manager | Repeated unexplained disparity by role and level | Review interview evidence and assessment validity | Business-unit leader and HR |
| Early-tenure retention | HR analytics | Cohort retention falls below the agreed baseline | Analyze exit and stay-interview findings | HR business partner |
Agree on thresholds before reporting, allowing for sample size and uncertainty. Give each owner authority to start a review and escalate to the designated lead. Hiring managers remain responsible for consistent, job-related evaluation. The EEOC emphasizes that selection procedures with disproportionate effects must be job-related and consistent with business necessity.[4]
Use these baselines and assigned responsibilities to track funnel conversion alongside business results.
2. Track Hiring Funnel and Business Results
Define Representation and Stage Conversion Rates
Use the baselines and owners from Section 1 to track how candidates move through your funnel and how representation changes at each stage.
Keep demographic categories and self-ID rules consistent throughout. Calculate pass-through rate as candidates advancing ÷ candidates entering the stage × 100. Compare results only within the same job family, level, location, and seniority.
| Metric and formula | Business question | Reporting owner | What to investigate when results fall short |
|---|---|---|---|
| Applicant representation = group applicants ÷ all applicants × 100 | Are outreach channels reaching the intended talent pool? | Talent acquisition or recruiting analytics | Review sourcing channels, outreach language, job requirements, referral patterns, and geographic reach |
| Qualified-candidate representation = group qualified candidates ÷ all qualified candidates × 100 | Does the qualified pipeline reflect the sourcing pool? | Recruiter and hiring manager | Review screening rules, minimum qualifications, and recruiter calibration |
| Interview or offer representation = group candidates at stage ÷ all candidates at stage × 100 | Where could pipeline changes put hiring targets at risk? | Recruiting operations | Review interview questions, scoring rubrics, panel composition, interviewer training, and scheduling access |
| Pass-through rate = group candidates advancing ÷ group candidates entering stage × 100 | Where do advancement rates differ? | Recruiting operations | Review assessment criteria and scoring consistency |
| Offer acceptance rate = group offers accepted ÷ group offers extended × 100 | Where are offers being declined? | Recruiter and compensation partner | Review compensation, approval delays, flexibility, communication, and competing offers |
| Hire representation = group hires ÷ all hires × 100 | How does the final result compare with earlier stages? | Talent leader | Trace losses between offers, acceptances, and starts |
| Candidate-experience favorability = favorable group responses ÷ valid group responses × 100 | Does candidate experience affect offer acceptance or drop-off? | Recruiting operations | Review feedback by stage and survey response rates |
Report counts alongside percentages. Use candidate surveys only when sample sizes support meaningful comparisons.
For selection-rate checks, compare each group’s rate with the highest rate at the same stage. The EEOC identifies 80% as a practical screening threshold: a rate below four-fifths of the highest group’s rate can indicate potential adverse impact and should prompt investigation.[5] This threshold is not proof of discrimination.
Once you can see stage gaps, test whether they affect hiring speed, cost, or retention.
Connect Funnel Results to Cost, Speed, and Retention
Pair conversion rates with time in stage and time to fill. Track hiring-plan completion as completed hires ÷ planned hires.
Assess each source by its reach, qualified-candidate representation, cost per qualified candidate, and cost per hire. Use the findings to improve outreach or rate your recruitment process to identify gaps, rather than selecting or rejecting individuals based on demographic identity.
Calculate cost per hire as defined recruiting costs ÷ hires in the reporting period. Document which labor, advertising, technology, assessment, and other costs you include so comparisons stay consistent.
Define quality of hire before comparing results, then use the same measure in every review. Track 12-month retention as cohort hires still employed after 12 months ÷ all hires in that cohort. Measure it only once the cohort reaches its 12-month anniversary.
Compare engagement and promotion within similar roles, locations, seniority, and tenure. Check that gains in representation do not come at the expense of quality, speed, or retention.
Separate Activity Metrics From Hiring Outcomes
| Metric category | Examples | Business question | Limitation |
|---|---|---|---|
| Activity metrics | Outreach messages, career-event attendance, applications, referrals, sourcing-channel reach | Are recruiting efforts generating enough interest and reach? | More activity can increase volume without improving hires. |
| Funnel metrics | Qualified-candidate rate, interview pass-through, offer rate, offer acceptance, time in stage, representation by stage | Where do qualified candidates advance or leave the process? | A gap does not explain its cause. |
| Business outcomes | Hiring-plan completion, time to fill, cost per hire, quality of hire, 12-month retention, engagement, promotion | Is recruiting supporting organizational performance? | These results take time to appear and reflect factors beyond recruiting. |
Review leading indicators first, then outcomes. Use qualified-pipeline volume and stage conversion to flag risks to your hiring plan. Then check completed hires, final costs, and retention to see whether your changes improved results.
3. Investigate Gaps and Track Progress
Choose Actions Based on Funnel Gaps
When a funnel gap appears, start with the business goal at risk. Find the first material gap by comparing similar roles, locations, levels, and sources. Review recruiter or hiring-manager patterns only when sample sizes are large enough and privacy rules allow.
Check the process at that stage: sourcing, screening, scoring, offers, compensation, onboarding, manager support, or promotion access. For each fix, assign one owner, deadline, expected result, and review date.
Retest the original metric using the same definitions and comparable cohorts. Record other changes, including pay bands, job requirements, or hiring managers, so you can assess what drove the result. Check whether the gap narrowed, the business goal improved, or a new bottleneck appeared. One small cohort is not enough to confirm success.
Build a Dashboard and Set Review Dates
Use one dashboard per active goal. Include relevant priority-stage representation and selection rates; source volume, conversion, and quality; hiring-plan progress; cost per hire; time-to-fill; retention; and promotion.
For every metric, show the baseline, current result, target, sample size, owner, and next action. This gives you a clear view of hiring performance, costs, and who needs to act.
Review active requisitions weekly or every two weeks, funnel and source trends monthly, and longer-term outcomes quarterly. Allow enough time for outcomes to mature. Give leaders a short update covering progress, hiring and financial results, completed fixes, and next priorities.
Before acting on the dashboard, verify the data behind it.
Protect Demographic Data and Check Findings
Check for missing self-identification, duplicate records, inconsistent stage definitions or source labels, and incorrect denominators. Never infer undisclosed identities.
Restrict access to demographic data, keep identifying details separate from reporting, and set retention and deletion rules. Aggregate or suppress small groups where results could identify individuals. Do not combine unrelated roles just to increase the sample size.
Treat the four-fifths rule as a review flag, not a finding of discrimination.[5] Sample size and process evidence still matter.
Conclusion: Start With One Goal and Measure Results
With your baseline, recruitment metrics, and owners in place, start with one business goal, one priority job family, and one fixed measurement period.
Test whether the process improves hiring outcomes. Measure business results, not representation alone. Use diversity metrics to identify process changes that support your goal, and expand only when the pilot produces reliable data and repeatable gains.
If your team lacks the capacity for consistent measurement and reporting, talk to Rent a Recruiter about embedded recruiters. Their support can help keep execution and reporting on track, while accountability for outcomes stays within your organization.
FAQs
How can we measure progress with small hiring samples?
When hiring samples are small, use ranges or minimum thresholds instead of single-point percentages that can skew the picture [1]. Review two to three years of historical data so short-term fluctuations don’t drive hiring decisions [1].
Track metrics at specific funnel stages, such as interview progression and offer acceptance, to see where representation drops off [2][1]. Look for repeatable patterns, then test small process changes and measure their effect over time [1].
How do we set realistic diversity metric targets?
Build your baseline using applicant tracking system or HRIS data, broken down by department, job level, and seniority. Compare your figures with industry benchmarks and local labor market data. Then set SMART goals tied to business growth over the next 6 to 18 months, so hiring plans reflect where your business needs to grow.
Track conversion rates at every hiring stage to see where progress stalls. Use the four-fifths rule to monitor for adverse impact, and review and adjust your approach quarterly.
How can we tell which process changes improved results?
Set a clear baseline before changing your hiring process. Review metrics regularly, ideally monthly during active hiring, and compare results with targets for each role or funnel stage.
Track conversion rates and funnel health to check whether changes, such as revising an interview rubric or anonymizing resumes, have resolved the bottlenecks you identified. Pair these results with candidate feedback to assess whether the changes delivered the intended impact on diversity and hiring quality.